
-
市场
-
产品
-
资讯
-
Moo社区
-
课堂
-
查看更多
-
功能介绍
-
费用费用透明,无最低余额限制
投资选择、功能介绍、费用相关信息由Moomoo Financial Inc.提供
- English
- 中文繁體
- 中文简体
- 深色
- 浅色
PAX Global Technology (HKG:327) Sheds 5.8% This Week, as Yearly Returns Fall More in Line With Earnings Growth
PAX Global Technology (HKG:327) Sheds 5.8% This Week, as Yearly Returns Fall More in Line With Earnings Growth
PAX Global Technology Limited (HKG:327) shareholders might be concerned after seeing the share price drop 11% in the last month. But that shouldn't obscure the pleasing returns achieved by shareholders over the last three years. To wit, the share price did better than an index fund, climbing 96% during that period.
Since the long term performance has been good but there's been a recent pullback of 5.8%, let's check if the fundamentals match the share price.
View our latest analysis for PAX Global Technology
While markets are a powerful pricing mechanism, share prices reflect investor sentiment, not just underlying business performance. By comparing earnings per share (EPS) and share price changes over time, we can get a feel for how investor attitudes to a company have morphed over time.
During three years of share price growth, PAX Global Technology achieved compound earnings per share growth of 30% per year. We don't think it is entirely coincidental that the EPS growth is reasonably close to the 25% average annual increase in the share price. This suggests that sentiment and expectations have not changed drastically. Quite to the contrary, the share price has arguably reflected the EPS growth.
The company's earnings per share (over time) is depicted in the image below (click to see the exact numbers).
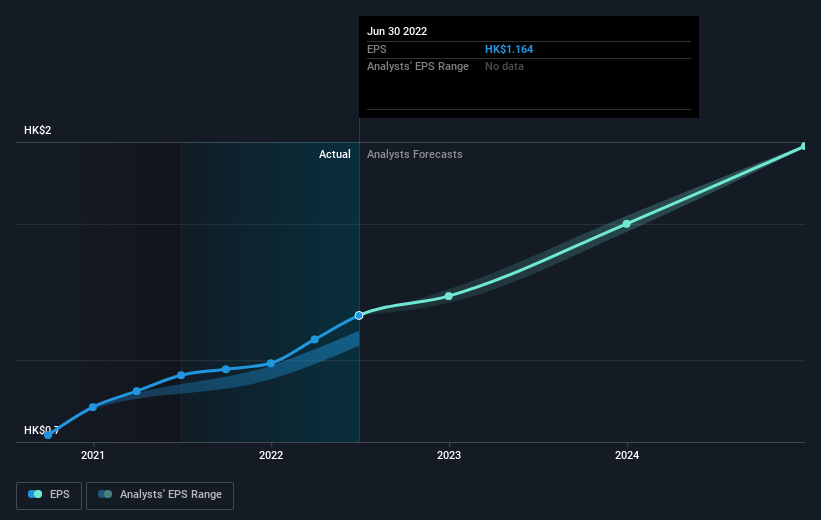 SEHK:327 Earnings Per Share Growth September 20th 2022
We know that PAX Global Technology has improved its bottom line lately, but is it going to grow revenue? You could check out this free report showing analyst revenue forecasts.
What About Dividends?
It is important to consider the total shareholder return, as well as the share price return, for any given stock. The TSR incorporates the value of any spin-offs or discounted capital raisings, along with any dividends, based on the assumption that the dividends are reinvested. So for companies that pay a generous dividend, the TSR is often a lot higher than the share price return. In the case of PAX Global Technology, it has a TSR of 120% for the last 3 years. That exceeds its share price return that we previously mentioned. And there's no prize for guessing that the dividend payments largely explain the divergence!
A Different Perspective
While the broader market lost about 19% in the twelve months, PAX Global Technology shareholders did even worse, losing 26% (even including dividends). However, it could simply be that the share price has been impacted by broader market jitters. It might be worth keeping an eye on the fundamentals, in case there's a good opportunity. Longer term investors wouldn't be so upset, since they would have made 15%, each year, over five years. If the fundamental data continues to indicate long term sustainable growth, the current sell-off could be an opportunity worth considering. While it is well worth considering the different impacts that market conditions can have on the share price, there are other factors that are even more important. Consider for instance, the ever-present spectre of investment risk. We've identified 2 warning signs with PAX Global Technology (at least 1 which shouldn't be ignored) , and understanding them should be part of your investment process.
Of course PAX Global Technology may not be the best stock to buy. So you may wish to see this free collection of growth stocks.
Please note, the market returns quoted in this article reflect the market weighted average returns of stocks that currently trade on HK exchanges.
Have feedback on this article? Concerned about the content? Get in touch with us directly. Alternatively, email editorial-team (at) simplywallst.com.
This article by Simply Wall St is general in nature. We provide commentary based on historical data and analyst forecasts only using an unbiased methodology and our articles are not intended to be financial advice. It does not constitute a recommendation to buy or sell any stock, and does not take account of your objectives, or your financial situation. We aim to bring you long-term focused analysis driven by fundamental data. Note that our analysis may not factor in the latest price-sensitive company announcements or qualitative material. Simply Wall St has no position in any stocks mentioned.
PAX 环球技术有限公司 (HKG: 327) 股东在看到上个月股价下跌11%后可能会感到担忧。但这不应掩盖股东在过去三年中获得的令人愉快的回报。换句话说,股价表现好于指数基金,在此期间上涨了96%。
由于长期表现不错,但最近回调了5.8%,让我们来看看基本面是否与股价相符。
查看我们对 PAX 全球技术的最新分析
虽然市场是一种强大的定价机制,但股价反映了投资者的情绪,而不仅仅是潜在的业务表现。通过比较每股收益(EPS)和一段时间内的股价变化,我们可以了解投资者对公司的态度是如何随着时间的推移而变化的。
在三年的股价增长中,PAX Global Technology实现了每年30%的复合每股收益增长。我们认为,每股收益增长相当接近股价平均年增长25%,这并不完全是巧合。这表明情绪和预期并未发生重大变化。恰恰相反,股价可以说反映了每股收益的增长。
该公司的每股收益(随着时间的推移)如下图所示(点击查看确切数字)。
联交所:327 2022年9月20日每股收益增长我们知道PAX Global Technology最近提高了利润,但它会增加收入吗?你可以看看这个 免费的 显示分析师收入预测的报告。
那股息呢?
重要的是要考虑任何给定股票的股东总回报以及股价回报率。TSR纳入了任何分拆或折扣资本筹集的价值以及任何股息,前提是股息是再投资的。因此,对于支付丰厚股息的公司来说,股东总回报率通常远高于股价回报率。就PAX Global Technology而言,其在过去3年中的股东总回报率为120%。这超过了我们之前提到的股价回报率。而且,猜测股息支付在很大程度上解释了这种分歧是没有好处的!
不同的视角
尽管整个市场在十二个月内下跌了约19%,但PAX Global Technology的股东表现更差,损失了26%(甚至包括股息)。但是,可能仅仅是股价受到了更广泛的市场紧张情绪的影响。如果有很好的机会,可能值得关注基本面。长期投资者不会那么沮丧,因为他们将在五年内每年赚15%。如果基本面数据继续表明长期可持续增长,那么当前的抛售可能是一个值得考虑的机会。尽管值得考虑市场状况可能对股价产生的不同影响,但还有其他更为重要的因素。例如,以永远存在的投资风险幽灵为例。 我们已经确定了 2 个警告信号 使用PAX Global Technology(至少 1 个,不容忽视),了解它们应该是你投资过程的一部分。
当然 PAX 环球科技可能不是最值得买入的股票。所以你可能希望看到这个 免费的 成长型股票的收集。
请注意,本文引用的市场回报反映了目前在香港交易所交易的股票的市场加权平均回报。
对这篇文章有反馈吗?对内容感到担忧? 取得联系 直接和我们联系。 或者,给编辑团队 (at) simplywallst.com 发送电子邮件。
Simply Wall St 的这篇文章本质上是一般性的。 我们仅使用不偏不倚的方法根据历史数据和分析师预测提供评论,我们的文章并非旨在提供财务建议。 它不构成买入或卖出任何股票的建议,也没有考虑您的目标或财务状况。我们的目标是为您提供由基本面数据驱动的长期重点分析。请注意,我们的分析可能未将最新的价格敏感型公司公告或定性材料考虑在内。简而言之,华尔街对上述任何股票都没有头寸。
moomoo是Moomoo Technologies Inc.公司提供的金融信息和交易应用程序。
在美国,moomoo上的投资产品和服务由Moomoo Financial Inc.提供,一家受美国证券交易委员会(SEC)监管的持牌主体。 Moomoo Financial Inc.是金融业监管局(FINRA)和证券投资者保护公司(SIPC)的成员。
在新加坡,moomoo上的投资产品和服务是通过Moomoo Financial Singapore Pte. Ltd.提供,该公司受新加坡金融管理局(MAS)监管(牌照号码︰CMS101000) ,持有资本市场服务牌照 (CMS) ,持有财务顾问豁免(Exempt Financial Adviser)资质。本内容未经新加坡金融管理局的审查。
在澳大利亚,moomoo上的金融产品和服务是通过Futu Securities (Australia) Ltd提供,该公司是受澳大利亚证券和投资委员会(ASIC)监管的澳大利亚金融服务许可机构(AFSL No. 224663)。请阅读并理解我们的《金融服务指南》、《条款与条件》、《隐私政策》和其他披露文件,这些文件可在我们的网站 https://www.moomoo.com/au中获取。
在加拿大,通过moomoo应用提供的仅限订单执行的券商服务由Moomoo Financial Canada Inc.提供,并受加拿大投资监管机构(CIRO)监管。
在马来西亚,moomoo上的投资产品和服务是通过Moomoo Securities Malaysia Sdn. Bhd. 提供,该公司受马来西亚证券监督委员会(SC)监管(牌照号码︰eCMSL/A0397/2024) ,持有资本市场服务牌照 (CMSL) 。本内容未经马来西亚证券监督委员会的审查。
Moomoo Technologies Inc., Moomoo Financial Inc., Moomoo Financial Singapore Pte. Ltd., Futu Securities (Australia) Ltd, Moomoo Financial Canada Inc.,和Moomoo Securities Malaysia Sdn. Bhd.是关联公司。
风险及免责提示
moomoo是Moomoo Technologies Inc.公司提供的金融信息和交易应用程序。
在美国,moomoo上的投资产品和服务由Moomoo Financial Inc.提供,一家受美国证券交易委员会(SEC)监管的持牌主体。 Moomoo Financial Inc.是金融业监管局(FINRA)和证券投资者保护公司(SIPC)的成员。
在新加坡,moomoo上的投资产品和服务是通过Moomoo Financial Singapore Pte. Ltd.提供,该公司受新加坡金融管理局(MAS)监管(牌照号码︰CMS101000) ,持有资本市场服务牌照 (CMS) ,持有财务顾问豁免(Exempt Financial Adviser)资质。本内容未经新加坡金融管理局的审查。
在澳大利亚,moomoo上的金融产品和服务是通过Futu Securities (Australia) Ltd提供,该公司是受澳大利亚证券和投资委员会(ASIC)监管的澳大利亚金融服务许可机构(AFSL No. 224663)。请阅读并理解我们的《金融服务指南》、《条款与条件》、《隐私政策》和其他披露文件,这些文件可在我们的网站 https://www.moomoo.com/au中获取。
在加拿大,通过moomoo应用提供的仅限订单执行的券商服务由Moomoo Financial Canada Inc.提供,并受加拿大投资监管机构(CIRO)监管。
在马来西亚,moomoo上的投资产品和服务是通过Moomoo Securities Malaysia Sdn. Bhd. 提供,该公司受马来西亚证券监督委员会(SC)监管(牌照号码︰eCMSL/A0397/2024) ,持有资本市场服务牌照 (CMSL) 。本内容未经马来西亚证券监督委员会的审查。
Moomoo Technologies Inc., Moomoo Financial Inc., Moomoo Financial Singapore Pte. Ltd., Futu Securities (Australia) Ltd, Moomoo Financial Canada Inc.,和Moomoo Securities Malaysia Sdn. Bhd.是关联公司。
- 分享到weixin
- 分享到qq
- 分享到facebook
- 分享到twitter
- 分享到微博
- 粘贴板
使用浏览器的分享功能,分享给你的好友吧