
-
市场
-
产品
-
资讯
-
Moo社区
-
课堂
-
查看更多
-
功能介绍
-
费用费用透明,无最低余额限制
投资选择、功能介绍、费用相关信息由Moomoo Financial Inc.提供
- English
- 中文繁體
- 中文简体
- 深色
- 浅色
VSTECS Holdings' (HKG:856) Shareholders Have More To Worry About Than Only Soft Earnings
VSTECS Holdings' (HKG:856) Shareholders Have More To Worry About Than Only Soft Earnings
VSTECS Holdings Limited's (HKG:856) recent weak earnings report didn't cause a big stock movement. Our analysis suggests that along with soft profit numbers, investors should be aware of some other underlying weaknesses in the numbers.
See our latest analysis for VSTECS Holdings
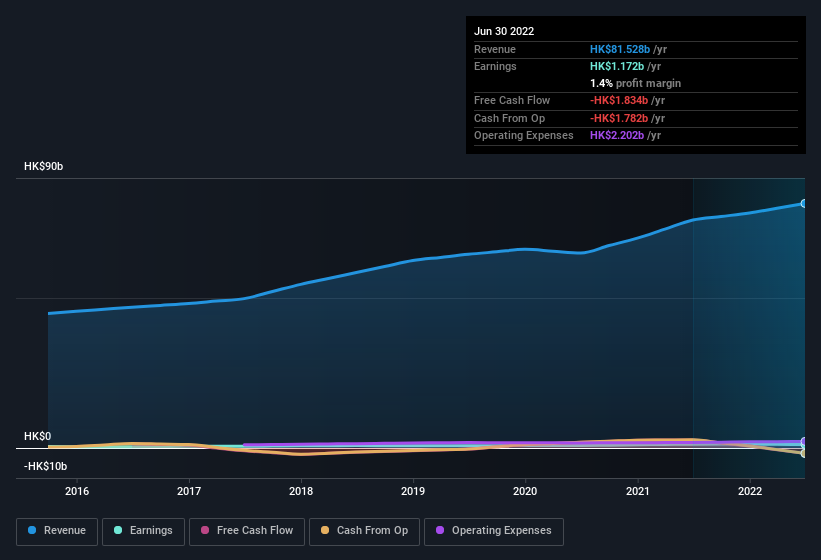 SEHK:856 Earnings and Revenue History September 20th 2022
Examining Cashflow Against VSTECS Holdings' Earnings
As finance nerds would already know, the accrual ratio from cashflow is a key measure for assessing how well a company's free cash flow (FCF) matches its profit. The accrual ratio subtracts the FCF from the profit for a given period, and divides the result by the average operating assets of the company over that time. The ratio shows us how much a company's profit exceeds its FCF.
Therefore, it's actually considered a good thing when a company has a negative accrual ratio, but a bad thing if its accrual ratio is positive. That is not intended to imply we should worry about a positive accrual ratio, but it's worth noting where the accrual ratio is rather high. Notably, there is some academic evidence that suggests that a high accrual ratio is a bad sign for near-term profits, generally speaking.
For the year to June 2022, VSTECS Holdings had an accrual ratio of 0.33. Therefore, we know that it's free cashflow was significantly lower than its statutory profit, raising questions about how useful that profit figure really is. Over the last year it actually had negative free cash flow of HK$1.8b, in contrast to the aforementioned profit of HK$1.17b. It's worth noting that VSTECS Holdings generated positive FCF of HK$2.7b a year ago, so at least they've done it in the past. The good news for shareholders is that VSTECS Holdings' accrual ratio was much better last year, so this year's poor reading might simply be a case of a short term mismatch between profit and FCF. Shareholders should look for improved cashflow relative to profit in the current year, if that is indeed the case.
That might leave you wondering what analysts are forecasting in terms of future profitability. Luckily, you can click here to see an interactive graph depicting future profitability, based on their estimates.
Our Take On VSTECS Holdings' Profit Performance
As we discussed above, we think VSTECS Holdings' earnings were not supported by free cash flow, which might concern some investors. For this reason, we think that VSTECS Holdings' statutory profits may be a bad guide to its underlying earnings power, and might give investors an overly positive impression of the company. Nonetheless, it's still worth noting that its earnings per share have grown at 53% over the last three years. At the end of the day, it's essential to consider more than just the factors above, if you want to understand the company properly. With this in mind, we wouldn't consider investing in a stock unless we had a thorough understanding of the risks. Case in point: We've spotted 3 warning signs for VSTECS Holdings you should be mindful of and 2 of these shouldn't be ignored.
Today we've zoomed in on a single data point to better understand the nature of VSTECS Holdings' profit. But there are plenty of other ways to inform your opinion of a company. Some people consider a high return on equity to be a good sign of a quality business. While it might take a little research on your behalf, you may find this free collection of companies boasting high return on equity, or this list of stocks that insiders are buying to be useful.
Have feedback on this article? Concerned about the content? Get in touch with us directly. Alternatively, email editorial-team (at) simplywallst.com.
This article by Simply Wall St is general in nature. We provide commentary based on historical data and analyst forecasts only using an unbiased methodology and our articles are not intended to be financial advice. It does not constitute a recommendation to buy or sell any stock, and does not take account of your objectives, or your financial situation. We aim to bring you long-term focused analysis driven by fundamental data. Note that our analysis may not factor in the latest price-sensitive company announcements or qualitative material. Simply Wall St has no position in any stocks mentioned.
VSTECS控股有限公司(HKG:856)近期疲弱的盈利报告并未导致股市大幅波动。我们的分析表明,除了疲软的利润数据外,投资者还应该意识到数字中的其他一些潜在弱点。
查看我们对VSTECS Holdings的最新分析
联交所:856盈利及收入历史2022年9月20日检查VSTECS Holdings的现金流和收益
正如金融书呆子们已经知道的那样,现金流应计比率是评估一家公司的自由现金流(FCF)与利润匹配程度的关键指标。应计制比率从给定期间的利润中减去FCF,然后将结果除以该时间段内公司的平均运营资产。这个比率向我们展示了一家公司的利润超过了它的FCF的多少。
因此,当一家公司的应计比率为负时,它实际上被认为是一件好事,但如果它的应计比率为正,那就是一件坏事。这并不意味着我们应该担心应计比率为正,但值得注意的是,在应计比率相当高的地方。值得注意的是,有一些学术证据表明,一般来说,高应计比率对短期利润来说不是一个好兆头。
在截至2022年6月的一年中,VSTECS Holdings的应计比率为0.33。因此,我们知道它的自由现金流明显低于其法定利润,这引发了人们对这个利润数字到底有多大用处的疑问。在过去的一年里,它实际上负面自由现金流为港币18亿元,而上述盈利为港币11.7亿元。值得注意的是,VSTECS Holdings一年前产生了27亿港元的正FCF,所以至少他们过去做到了。对股东来说,好消息是VSTECS Holdings去年的应计比率要好得多,因此今年的糟糕读数可能只是利润和FCF短期错配的一个例子。如果情况确实如此,股东应该期待本年度相对于利润的现金流有所改善。
这可能会让你想知道,分析师对未来盈利能力的预测是什么。幸运的是,您可以单击此处查看基于他们估计的未来盈利能力的互动图表。
我们对VSTECS Holdings的利润表现的看法
正如我们上面讨论的,我们认为VSTECS Holdings的收益没有得到自由现金流的支持,这可能会让一些投资者感到担忧。出于这个原因,我们认为VSTECS Holdings的法定利润可能是其潜在盈利能力的不良指引,可能会给投资者带来对该公司过于乐观的印象。尽管如此,值得注意的是,它的每股收益在过去三年里以53%的速度增长。归根结底,如果你想正确地了解这家公司,除了以上几个因素之外,考虑其他因素也是至关重要的。考虑到这一点,除非我们对风险有透彻的了解,否则我们不会考虑投资股票。一个恰当的例子:我们发现了VSTECS Holdings的3个警告信号你应该注意这两点,其中两点不应该被忽视。
今天,我们放大了一个数据点,以更好地了解VSTECS Holdings的利润性质。但还有很多其他方式可以让你了解一家公司的看法。一些人认为,高股本回报率是高质量企业的良好标志。虽然这可能需要为您做一些研究,但您可能会发现免费拥有高股本回报率的公司的集合,或者是内部人士购买的有用的股票清单。
对这篇文章有什么反馈吗?担心内容吗? 保持联系直接与我们联系。或者,也可以给编辑组发电子邮件,地址是implywallst.com。
本文由Simply Wall St.撰写,具有概括性。我们仅使用不偏不倚的方法提供基于历史数据和分析师预测的评论,我们的文章并不打算作为财务建议。它不构成买卖任何股票的建议,也没有考虑你的目标或你的财务状况。我们的目标是为您带来由基本面数据驱动的长期重点分析。请注意,我们的分析可能不会将最新的对价格敏感的公司公告或定性材料考虑在内。Simply Wall St.对上述任何一只股票都没有持仓。
moomoo是Moomoo Technologies Inc.公司提供的金融信息和交易应用程序。
在美国,moomoo上的投资产品和服务由Moomoo Financial Inc.提供,一家受美国证券交易委员会(SEC)监管的持牌主体。 Moomoo Financial Inc.是金融业监管局(FINRA)和证券投资者保护公司(SIPC)的成员。
在新加坡,moomoo上的投资产品和服务是通过Moomoo Financial Singapore Pte. Ltd.提供,该公司受新加坡金融管理局(MAS)监管(牌照号码︰CMS101000) ,持有资本市场服务牌照 (CMS) ,持有财务顾问豁免(Exempt Financial Adviser)资质。本内容未经新加坡金融管理局的审查。
在澳大利亚,moomoo上的金融产品和服务是通过Futu Securities (Australia) Ltd提供,该公司是受澳大利亚证券和投资委员会(ASIC)监管的澳大利亚金融服务许可机构(AFSL No. 224663)。请阅读并理解我们的《金融服务指南》、《条款与条件》、《隐私政策》和其他披露文件,这些文件可在我们的网站 https://www.moomoo.com/au中获取。
在加拿大,通过moomoo应用提供的仅限订单执行的券商服务由Moomoo Financial Canada Inc.提供,并受加拿大投资监管机构(CIRO)监管。
在马来西亚,moomoo上的投资产品和服务是通过Moomoo Securities Malaysia Sdn. Bhd. 提供,该公司受马来西亚证券监督委员会(SC)监管(牌照号码︰eCMSL/A0397/2024) ,持有资本市场服务牌照 (CMSL) 。本内容未经马来西亚证券监督委员会的审查。
Moomoo Technologies Inc., Moomoo Financial Inc., Moomoo Financial Singapore Pte. Ltd., Futu Securities (Australia) Ltd, Moomoo Financial Canada Inc.,和Moomoo Securities Malaysia Sdn. Bhd.是关联公司。
风险及免责提示
moomoo是Moomoo Technologies Inc.公司提供的金融信息和交易应用程序。
在美国,moomoo上的投资产品和服务由Moomoo Financial Inc.提供,一家受美国证券交易委员会(SEC)监管的持牌主体。 Moomoo Financial Inc.是金融业监管局(FINRA)和证券投资者保护公司(SIPC)的成员。
在新加坡,moomoo上的投资产品和服务是通过Moomoo Financial Singapore Pte. Ltd.提供,该公司受新加坡金融管理局(MAS)监管(牌照号码︰CMS101000) ,持有资本市场服务牌照 (CMS) ,持有财务顾问豁免(Exempt Financial Adviser)资质。本内容未经新加坡金融管理局的审查。
在澳大利亚,moomoo上的金融产品和服务是通过Futu Securities (Australia) Ltd提供,该公司是受澳大利亚证券和投资委员会(ASIC)监管的澳大利亚金融服务许可机构(AFSL No. 224663)。请阅读并理解我们的《金融服务指南》、《条款与条件》、《隐私政策》和其他披露文件,这些文件可在我们的网站 https://www.moomoo.com/au中获取。
在加拿大,通过moomoo应用提供的仅限订单执行的券商服务由Moomoo Financial Canada Inc.提供,并受加拿大投资监管机构(CIRO)监管。
在马来西亚,moomoo上的投资产品和服务是通过Moomoo Securities Malaysia Sdn. Bhd. 提供,该公司受马来西亚证券监督委员会(SC)监管(牌照号码︰eCMSL/A0397/2024) ,持有资本市场服务牌照 (CMSL) 。本内容未经马来西亚证券监督委员会的审查。
Moomoo Technologies Inc., Moomoo Financial Inc., Moomoo Financial Singapore Pte. Ltd., Futu Securities (Australia) Ltd, Moomoo Financial Canada Inc.,和Moomoo Securities Malaysia Sdn. Bhd.是关联公司。
- 分享到weixin
- 分享到qq
- 分享到facebook
- 分享到twitter
- 分享到微博
- 粘贴板
使用浏览器的分享功能,分享给你的好友吧