Today we will run through one way of estimating the intrinsic value of Canggang Railway Limited (HKG:2169) by projecting its future cash flows and then discounting them to today's value. We will use the Discounted Cash Flow (DCF) model on this occasion. Believe it or not, it's not too difficult to follow, as you'll see from our example!
Remember though, that there are many ways to estimate a company's value, and a DCF is just one method. If you want to learn more about discounted cash flow, the rationale behind this calculation can be read in detail in the Simply Wall St analysis model.
Check out our latest analysis for Canggang Railway
Is Canggang Railway Fairly Valued?
We are going to use a two-stage DCF model, which, as the name states, takes into account two stages of growth. The first stage is generally a higher growth period which levels off heading towards the terminal value, captured in the second 'steady growth' period. To begin with, we have to get estimates of the next ten years of cash flows. Seeing as no analyst estimates of free cash flow are available to us, we have extrapolate the previous free cash flow (FCF) from the company's last reported value. We assume companies with shrinking free cash flow will slow their rate of shrinkage, and that companies with growing free cash flow will see their growth rate slow, over this period. We do this to reflect that growth tends to slow more in the early years than it does in later years.
Generally we assume that a dollar today is more valuable than a dollar in the future, and so the sum of these future cash flows is then discounted to today's value:
10-year free cash flow (FCF) estimate
| 2023 | 2024 | 2025 | 2026 | 2027 | 2028 | 2029 | 2030 | 2031 | 2032 |
| Levered FCF (CN¥, Millions) | CN¥94.5m | CN¥99.6m | CN¥103.9m | CN¥107.5m | CN¥110.6m | CN¥113.3m | CN¥115.8m | CN¥118.1m | CN¥120.3m | CN¥122.5m |
| Growth Rate Estimate Source | Est @ 7.1% | Est @ 5.43% | Est @ 4.27% | Est @ 3.45% | Est @ 2.88% | Est @ 2.48% | Est @ 2.2% | Est @ 2.01% | Est @ 1.87% | Est @ 1.77% |
| Present Value (CN¥, Millions) Discounted @ 6.8% | CN¥88.5 | CN¥87.3 | CN¥85.3 | CN¥82.6 | CN¥79.6 | CN¥76.4 | CN¥73.1 | CN¥69.8 | CN¥66.6 | CN¥63.4 |
("Est" = FCF growth rate estimated by Simply Wall St)
Present Value of 10-year Cash Flow (PVCF) = CN¥772m
We now need to calculate the Terminal Value, which accounts for all the future cash flows after this ten year period. For a number of reasons a very conservative growth rate is used that cannot exceed that of a country's GDP growth. In this case we have used the 5-year average of the 10-year government bond yield (1.6%) to estimate future growth. In the same way as with the 10-year 'growth' period, we discount future cash flows to today's value, using a cost of equity of 6.8%.
Terminal Value (TV)= FCF2032 × (1 + g) ÷ (r – g) = CN¥122m× (1 + 1.6%) ÷ (6.8%– 1.6%) = CN¥2.4b
Present Value of Terminal Value (PVTV)= TV / (1 + r)10= CN¥2.4b÷ ( 1 + 6.8%)10= CN¥1.2b
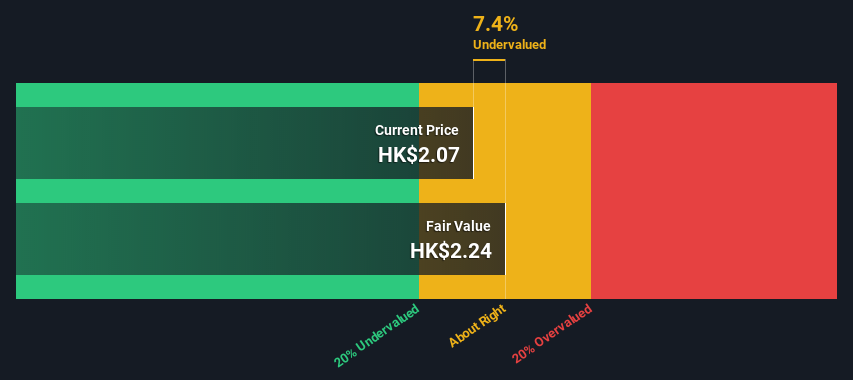
The total value, or equity value, is then the sum of the present value of the future cash flows, which in this case is CN¥2.0b. In the final step we divide the equity value by the number of shares outstanding. Relative to the current share price of HK$2.3, the company appears around fair value at the time of writing. Remember though, that this is just an approximate valuation, and like any complex formula - garbage in, garbage out.
SEHK:2169 Discounted Cash Flow September 15th 2022
The Assumptions
The calculation above is very dependent on two assumptions. The first is the discount rate and the other is the cash flows. You don't have to agree with these inputs, I recommend redoing the calculations yourself and playing with them. The DCF also does not consider the possible cyclicality of an industry, or a company's future capital requirements, so it does not give a full picture of a company's potential performance. Given that we are looking at Canggang Railway as potential shareholders, the cost of equity is used as the discount rate, rather than the cost of capital (or weighted average cost of capital, WACC) which accounts for debt. In this calculation we've used 6.8%, which is based on a levered beta of 1.063. Beta is a measure of a stock's volatility, compared to the market as a whole. We get our beta from the industry average beta of globally comparable companies, with an imposed limit between 0.8 and 2.0, which is a reasonable range for a stable business.
Next Steps:
Valuation is only one side of the coin in terms of building your investment thesis, and it ideally won't be the sole piece of analysis you scrutinize for a company. It's not possible to obtain a foolproof valuation with a DCF model. Rather it should be seen as a guide to "what assumptions need to be true for this stock to be under/overvalued?" If a company grows at a different rate, or if its cost of equity or risk free rate changes sharply, the output can look very different. For Canggang Railway, there are three relevant aspects you should further research:
- Risks: Be aware that Canggang Railway is showing 2 warning signs in our investment analysis , and 1 of those makes us a bit uncomfortable...
- Other High Quality Alternatives: Do you like a good all-rounder? Explore our interactive list of high quality stocks to get an idea of what else is out there you may be missing!
- Other Environmentally-Friendly Companies: Concerned about the environment and think consumers will buy eco-friendly products more and more? Browse through our interactive list of companies that are thinking about a greener future to discover some stocks you may not have thought of!
PS. Simply Wall St updates its DCF calculation for every Hong Kong stock every day, so if you want to find the intrinsic value of any other stock just search here.
Have feedback on this article? Concerned about the content? Get in touch with us directly. Alternatively, email editorial-team (at) simplywallst.com.
This article by Simply Wall St is general in nature. We provide commentary based on historical data and analyst forecasts only using an unbiased methodology and our articles are not intended to be financial advice. It does not constitute a recommendation to buy or sell any stock, and does not take account of your objectives, or your financial situation. We aim to bring you long-term focused analysis driven by fundamental data. Note that our analysis may not factor in the latest price-sensitive company announcements or qualitative material. Simply Wall St has no position in any stocks mentioned.
今天,我们将通过预测未来现金流并将其折现到今天的价值来评估苍钢铁路有限公司(HKG:2169)的内在价值。在这种情况下,我们将使用贴现现金流(DCF)模型。信不信由你,遵循它并不太难,正如您将从我们的示例中看到的那样!
不过请记住,有很多方法可以评估一家公司的价值,贴现现金流只是其中一种方法。如果你想了解更多关于贴现现金流的信息,可以在Simply Wall St.分析模型中详细阅读这种计算背后的原理。
查看我们对苍钢铁路的最新分析
苍钢铁路的估值是否公允?
我们将使用两阶段贴现现金流模型,顾名思义,该模型考虑了两个增长阶段。第一阶段通常是一个较高的成长期,接近终值,在第二个“稳定增长”阶段捕捉到。首先,我们必须对未来十年的现金流进行估计。由于没有分析师对自由现金流的估计,我们根据公司最近报告的价值推断出了之前的自由现金流(FCF)。我们假设,自由现金流萎缩的公司将减缓收缩速度,而自由现金流增长的公司在这段时间内的增长速度将放缓。我们这样做是为了反映出,增长在最初几年往往比后来几年放缓得更多。
一般来说,我们假设今天的一美元比未来的一美元更有价值,所以这些未来现金流的总和就会贴现到今天的价值:
10年自由现金流(FCF)估计
| 2023 | 2024 | 2025 | 2026 | 2027 | 2028 | 2029 | 2030 | 2031 | 2032 |
| 杠杆FCF(CN元,百万元) | CN元9450万元 | CN人民币9960万元 | CN元1.039亿元 | CN元1.075亿元 | CN元1.106亿元 | CN元1.133亿元 | 净额1.158亿元 | 净额1.181亿元 | CN元1.203亿元 | CN元1.225亿元 |
| 增长率预估来源 | EST@7.1% | Est@5.43% | Est@4.27% | Est@3.45% | Est@2.88% | Est@2.48% | Est@2.2% | Est@2.01% | Est@1.87% | Est@1.77% |
| 现值(CN元,百万元)贴现6.8% | CN元88.5元 | CN元87.3元 | CN元85.3元 | 人民币82.6元 | CN元79.6元 | CN元76.4元 | CN元73.1元 | CN元69.8元 | CN元66.6元 | CN元63.4元 |
(“EST”=Simply Wall St.预估的FCF成长率)
10年期现金流现值(PVCF)=CN元7.72亿元
我们现在需要计算终端价值,它说明了这十年之后的所有未来现金流。出于一些原因,使用了一个非常保守的增长率,不能超过一个国家的国内生产总值增长率。在这种情况下,我们使用了10年期政府债券收益率的5年平均值(1.6%)来估计未来的增长。与10年“增长”期一样,我们使用6.8%的权益成本将未来现金流贴现至当前价值。
终端值(TV)=FCF2032×(1+g)?(r-g)=CN元122M×(1+1.6%)?(6.8%-1.6%)=CN元2.4b
终值现值(PVTV)=TV/(1+r)10=CN元24亿?(1+6.8%)10=CN人民币12亿元
那么,总价值或股权价值就是未来现金流的现值之和,在这种情况下,现金流为20亿加元。在最后一步,我们用股本价值除以流通股的数量。相对于目前2.3港元的股价,该公司在撰写本文时似乎约为公允价值。不过,请记住,这只是一个大致的估值,就像任何复杂的公式一样--垃圾输入,垃圾输出。
联交所:2169贴现现金流2022年9月15日
假设
上述计算在很大程度上取决于两个假设。第一个是贴现率,另一个是现金流。您不必同意这些输入,我建议您自己重新计算并使用它们。DCF也没有考虑一个行业可能的周期性,也没有考虑一家公司未来的资本要求,因此它没有给出一家公司潜在业绩的全貌。鉴于我们将苍钢铁路视为潜在股东,股权成本被用作贴现率,而不是计入债务的资本成本(或加权平均资本成本,WACC)。在这个计算中,我们使用了6.8%,这是基于杠杆率为1.063的测试值。贝塔系数是衡量一只股票相对于整个市场的波动性的指标。我们的贝塔系数来自全球可比公司的行业平均贝塔系数,强制限制在0.8到2.0之间,这是一个稳定业务的合理范围。
接下来的步骤:
就构建你的投资论点而言,估值只是硬币的一面,理想情况下,它不会是你为一家公司仔细审查的唯一分析。用贴现现金流模型不可能获得万无一失的估值。相反,它应该被视为“什么假设需要成立才能让这只股票被低估或高估”的指南。如果一家公司以不同的速度增长,或者如果其股本成本或无风险利率大幅变化,产出可能看起来非常不同。对于苍钢铁路,有三个相关方面需要进一步研究:
- 风险:请注意,苍钢铁路正在展示我们的投资分析中的2个警告信号,其中一条让我们有点不舒服...
- 其他高质量替代产品:你喜欢一个好的全能运动员吗?浏览我们的高质量股票互动列表,了解您可能会错过的其他股票!
- 其他环保公司:关注环境,认为消费者会越来越多地购买环保产品?浏览我们的互动列表,这些公司正在考虑更绿色的未来,发现一些你可能没有想到的股票!
PS.Simply Wall St.每天更新每只香港股票的贴现现金流计算,所以如果你想找出任何其他股票的内在价值,只需搜索此处。
对这篇文章有什么反馈吗?担心内容吗? 保持联系直接与我们联系。或者,也可以给编辑组发电子邮件,地址是implywallst.com。
本文由Simply Wall St.撰写,具有概括性。我们仅使用不偏不倚的方法提供基于历史数据和分析师预测的评论,我们的文章并不打算作为财务建议。它不构成买卖任何股票的建议,也没有考虑你的目标或你的财务状况。我们的目标是为您带来由基本面数据驱动的长期重点分析。请注意,我们的分析可能不会将最新的对价格敏感的公司公告或定性材料考虑在内。Simply Wall St.对上述任何一只股票都没有持仓。
