
-
市场
-
产品
-
资讯
-
Moo社区
-
课堂
-
查看更多
-
功能介绍
-
费用费用透明,无最低余额限制
投资选择、功能介绍、费用相关信息由Moomoo Financial Inc.提供
- English
- 中文繁體
- 中文简体
- 深色
- 浅色
EEKA Fashion Holdings' (HKG:3709) 18% CAGR Outpaced the Company's Earnings Growth Over the Same Five-year Period
EEKA Fashion Holdings' (HKG:3709) 18% CAGR Outpaced the Company's Earnings Growth Over the Same Five-year Period
Generally speaking the aim of active stock picking is to find companies that provide returns that are superior to the market average. And while active stock picking involves risks (and requires diversification) it can also provide excess returns. To wit, the EEKA Fashion Holdings share price has climbed 90% in five years, easily topping the market decline of 23% (ignoring dividends). On the other hand, the more recent gains haven't been so impressive, with shareholders gaining just 5.5% , including dividends .
After a strong gain in the past week, it's worth seeing if longer term returns have been driven by improving fundamentals.
View our latest analysis for EEKA Fashion Holdings
To paraphrase Benjamin Graham: Over the short term the market is a voting machine, but over the long term it's a weighing machine. One flawed but reasonable way to assess how sentiment around a company has changed is to compare the earnings per share (EPS) with the share price.
During five years of share price growth, EEKA Fashion Holdings achieved compound earnings per share (EPS) growth of 13% per year. This EPS growth is reasonably close to the 14% average annual increase in the share price. This indicates that investor sentiment towards the company has not changed a great deal. Indeed, it would appear the share price is reacting to the EPS.
The company's earnings per share (over time) is depicted in the image below (click to see the exact numbers).
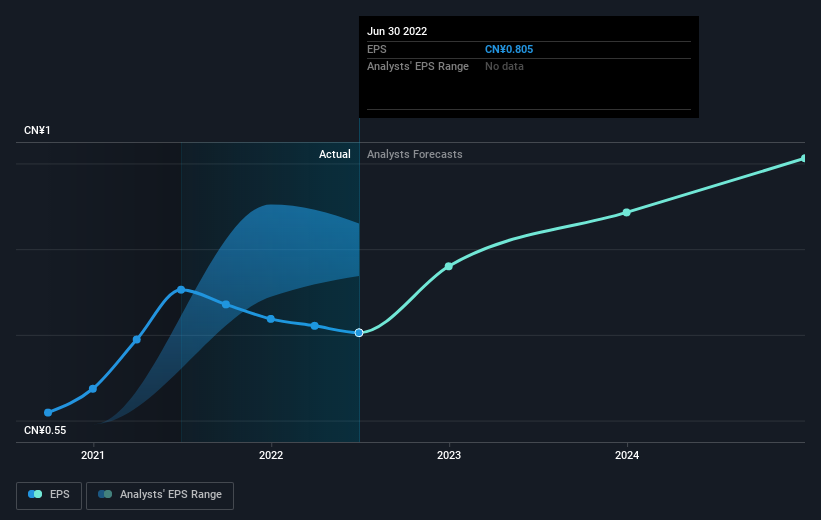 SEHK:3709 Earnings Per Share Growth September 14th 2022
We're pleased to report that the CEO is remunerated more modestly than most CEOs at similarly capitalized companies. It's always worth keeping an eye on CEO pay, but a more important question is whether the company will grow earnings throughout the years. Dive deeper into the earnings by checking this interactive graph of EEKA Fashion Holdings' earnings, revenue and cash flow.
What About Dividends?
It is important to consider the total shareholder return, as well as the share price return, for any given stock. The TSR incorporates the value of any spin-offs or discounted capital raisings, along with any dividends, based on the assumption that the dividends are reinvested. So for companies that pay a generous dividend, the TSR is often a lot higher than the share price return. As it happens, EEKA Fashion Holdings' TSR for the last 5 years was 127%, which exceeds the share price return mentioned earlier. The dividends paid by the company have thusly boosted the total shareholder return.
A Different Perspective
It's nice to see that EEKA Fashion Holdings shareholders have received a total shareholder return of 5.5% over the last year. That's including the dividend. However, that falls short of the 18% TSR per annum it has made for shareholders, each year, over five years. Potential buyers might understandably feel they've missed the opportunity, but it's always possible business is still firing on all cylinders. While it is well worth considering the different impacts that market conditions can have on the share price, there are other factors that are even more important. For instance, we've identified 1 warning sign for EEKA Fashion Holdings that you should be aware of.
For those who like to find winning investments this free list of growing companies with recent insider purchasing, could be just the ticket.
Please note, the market returns quoted in this article reflect the market weighted average returns of stocks that currently trade on HK exchanges.
Have feedback on this article? Concerned about the content? Get in touch with us directly. Alternatively, email editorial-team (at) simplywallst.com.
This article by Simply Wall St is general in nature. We provide commentary based on historical data and analyst forecasts only using an unbiased methodology and our articles are not intended to be financial advice. It does not constitute a recommendation to buy or sell any stock, and does not take account of your objectives, or your financial situation. We aim to bring you long-term focused analysis driven by fundamental data. Note that our analysis may not factor in the latest price-sensitive company announcements or qualitative material. Simply Wall St has no position in any stocks mentioned.
一般来说,主动选股的目的是找到那些提供高于市场平均水平的回报的公司。虽然主动选股会带来风险(并需要分散投资),但它也可以提供超额回报。也就是说,EEKA Fashion Holdings的股价在五年内攀升了90%,轻松超过了23%的市场跌幅(不考虑股息)。另一方面,最近的涨幅没有那么令人印象深刻,包括股息在内,股东的涨幅仅为5.5%。
在过去一周的强劲上涨之后,长期回报是否受到基本面改善的推动值得关注。
查看我们对EEKA时尚控股公司的最新分析
本杰明·格雷厄姆(Benjamin Graham)的原话是:短期内,市场是一台投票机,但从长远来看,它是一台称重机。评估围绕一家公司的情绪变化的一个有缺陷但合理的方法是将每股收益(EPS)与股价进行比较。
在股价增长的五年中,EEKA Fashion Holdings实现了每股收益(EPS)每年13%的复合增长。这一每股收益增长相当接近该公司股价14%的年均涨幅。这表明投资者对该公司的情绪没有太大变化。事实上,看起来股价是在对每股收益做出反应。
该公司的每股收益(在一段时间内)如下图所示(点击查看具体数字)。
联交所:每股盈利增长3709 2022年9月14日我们很高兴地报告,这位首席执行官的薪酬比类似资本公司的大多数首席执行官都要低。关注首席执行官的薪酬总是值得的,但更重要的问题是,该公司是否会在未来几年实现盈利增长。通过查看EEKA Fashion Holdings的收益、收入和现金流的互动图表,更深入地了解收益。
那股息呢?
重要的是要考虑任何给定股票的总股东回报以及股价回报。TSR包括任何剥离或贴现融资的价值,以及任何股息,基于股息再投资的假设。因此,对于支付丰厚股息的公司来说,TSR往往比股价回报高得多。碰巧的是,EEKA Fashion Holdings最近5年的TSR为127%,超过了前面提到的股价回报。该公司支付的股息因此提振了总计股东回报。
不同的视角
很高兴看到EEKA Fashion Holdings的股东在过去一年里获得了5.5%的总股东回报。这还包括股息。然而,这低于该公司在五年内每年为股东创造的18%的TSR。潜在买家可能会觉得不及预期期待着这个机会,这是可以理解的,但业务仍有可能仍然全速运转。虽然值得考虑市场状况对股价可能产生的不同影响,但还有其他更重要的因素。例如,我们已经确定EEKA时尚控股公司的1个警告标志这一点你应该知道。
对于那些想要找到赢得投资这免费最近有内幕收购的不断增长的公司名单可能就是合适的选择。
请注意,本文引用的市场回报反映了目前在香港交易所交易的股票的市场加权平均回报。
对这篇文章有什么反馈吗?担心内容吗? 保持联系直接与我们联系。或者,也可以给编辑组发电子邮件,地址是implywallst.com。
本文由Simply Wall St.撰写,具有概括性。我们仅使用不偏不倚的方法提供基于历史数据和分析师预测的评论,我们的文章并不打算作为财务建议。它不构成买卖任何股票的建议,也没有考虑你的目标或你的财务状况。我们的目标是为您带来由基本面数据驱动的长期重点分析。请注意,我们的分析可能不会将最新的对价格敏感的公司公告或定性材料考虑在内。Simply Wall St.对上述任何一只股票都没有持仓。
moomoo是Moomoo Technologies Inc.公司提供的金融信息和交易应用程序。
在美国,moomoo上的投资产品和服务由Moomoo Financial Inc.提供,一家受美国证券交易委员会(SEC)监管的持牌主体。 Moomoo Financial Inc.是金融业监管局(FINRA)和证券投资者保护公司(SIPC)的成员。
在新加坡,moomoo上的投资产品和服务是通过Moomoo Financial Singapore Pte. Ltd.提供,该公司受新加坡金融管理局(MAS)监管(牌照号码︰CMS101000) ,持有资本市场服务牌照 (CMS) ,持有财务顾问豁免(Exempt Financial Adviser)资质。本内容未经新加坡金融管理局的审查。
在澳大利亚,moomoo上的金融产品和服务是通过Futu Securities (Australia) Ltd提供,该公司是受澳大利亚证券和投资委员会(ASIC)监管的澳大利亚金融服务许可机构(AFSL No. 224663)。请阅读并理解我们的《金融服务指南》、《条款与条件》、《隐私政策》和其他披露文件,这些文件可在我们的网站 https://www.moomoo.com/au中获取。
在加拿大,通过moomoo应用提供的仅限订单执行的券商服务由Moomoo Financial Canada Inc.提供,并受加拿大投资监管机构(CIRO)监管。
在马来西亚,moomoo上的投资产品和服务是通过Moomoo Securities Malaysia Sdn. Bhd. 提供,该公司受马来西亚证券监督委员会(SC)监管(牌照号码︰eCMSL/A0397/2024) ,持有资本市场服务牌照 (CMSL) 。本内容未经马来西亚证券监督委员会的审查。
Moomoo Technologies Inc., Moomoo Financial Inc., Moomoo Financial Singapore Pte. Ltd., Futu Securities (Australia) Ltd, Moomoo Financial Canada Inc.,和Moomoo Securities Malaysia Sdn. Bhd.是关联公司。
风险及免责提示
moomoo是Moomoo Technologies Inc.公司提供的金融信息和交易应用程序。
在美国,moomoo上的投资产品和服务由Moomoo Financial Inc.提供,一家受美国证券交易委员会(SEC)监管的持牌主体。 Moomoo Financial Inc.是金融业监管局(FINRA)和证券投资者保护公司(SIPC)的成员。
在新加坡,moomoo上的投资产品和服务是通过Moomoo Financial Singapore Pte. Ltd.提供,该公司受新加坡金融管理局(MAS)监管(牌照号码︰CMS101000) ,持有资本市场服务牌照 (CMS) ,持有财务顾问豁免(Exempt Financial Adviser)资质。本内容未经新加坡金融管理局的审查。
在澳大利亚,moomoo上的金融产品和服务是通过Futu Securities (Australia) Ltd提供,该公司是受澳大利亚证券和投资委员会(ASIC)监管的澳大利亚金融服务许可机构(AFSL No. 224663)。请阅读并理解我们的《金融服务指南》、《条款与条件》、《隐私政策》和其他披露文件,这些文件可在我们的网站 https://www.moomoo.com/au中获取。
在加拿大,通过moomoo应用提供的仅限订单执行的券商服务由Moomoo Financial Canada Inc.提供,并受加拿大投资监管机构(CIRO)监管。
在马来西亚,moomoo上的投资产品和服务是通过Moomoo Securities Malaysia Sdn. Bhd. 提供,该公司受马来西亚证券监督委员会(SC)监管(牌照号码︰eCMSL/A0397/2024) ,持有资本市场服务牌照 (CMSL) 。本内容未经马来西亚证券监督委员会的审查。
Moomoo Technologies Inc., Moomoo Financial Inc., Moomoo Financial Singapore Pte. Ltd., Futu Securities (Australia) Ltd, Moomoo Financial Canada Inc.,和Moomoo Securities Malaysia Sdn. Bhd.是关联公司。
- 分享到weixin
- 分享到qq
- 分享到facebook
- 分享到twitter
- 分享到微博
- 粘贴板
使用浏览器的分享功能,分享给你的好友吧