
-
市场
-
产品
-
资讯
-
Moo社区
-
课堂
-
查看更多
-
功能介绍
-
费用费用透明,无最低余额限制
投资选择、功能介绍、费用相关信息由Moomoo Financial Inc.提供
- English
- 中文繁體
- 中文简体
- 深色
- 浅色
Is HK Electric Investments and HK Electric Investments (HKG:2638) A Risky Investment?
Is HK Electric Investments and HK Electric Investments (HKG:2638) A Risky Investment?
The external fund manager backed by Berkshire Hathaway's Charlie Munger, Li Lu, makes no bones about it when he says 'The biggest investment risk is not the volatility of prices, but whether you will suffer a permanent loss of capital.' So it might be obvious that you need to consider debt, when you think about how risky any given stock is, because too much debt can sink a company. Importantly, HK Electric Investments and HK Electric Investments Limited (HKG:2638) does carry debt. But the real question is whether this debt is making the company risky.
When Is Debt Dangerous?
Debt assists a business until the business has trouble paying it off, either with new capital or with free cash flow. Part and parcel of capitalism is the process of 'creative destruction' where failed businesses are mercilessly liquidated by their bankers. However, a more common (but still painful) scenario is that it has to raise new equity capital at a low price, thus permanently diluting shareholders. By replacing dilution, though, debt can be an extremely good tool for businesses that need capital to invest in growth at high rates of return. When we examine debt levels, we first consider both cash and debt levels, together.
View our latest analysis for HK Electric Investments and HK Electric Investments
What Is HK Electric Investments and HK Electric Investments's Debt?
The image below, which you can click on for greater detail, shows that at June 2022 HK Electric Investments and HK Electric Investments had debt of HK$49.7b, up from HK$46.4b in one year. Net debt is about the same, since the it doesn't have much cash.
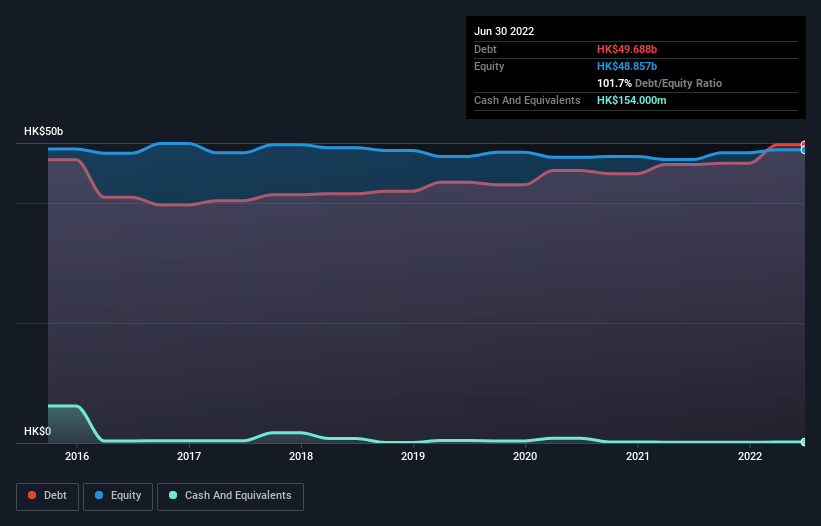 SEHK:2638 Debt to Equity History September 1st 2022
A Look At HK Electric Investments and HK Electric Investments' Liabilities
Zooming in on the latest balance sheet data, we can see that HK Electric Investments and HK Electric Investments had liabilities of HK$6.80b due within 12 months and liabilities of HK$63.1b due beyond that. Offsetting these obligations, it had cash of HK$154.0m as well as receivables valued at HK$1.66b due within 12 months. So it has liabilities totalling HK$68.1b more than its cash and near-term receivables, combined.
When you consider that this deficiency exceeds the company's HK$57.4b market capitalization, you might well be inclined to review the balance sheet intently. In the scenario where the company had to clean up its balance sheet quickly, it seems likely shareholders would suffer extensive dilution.
In order to size up a company's debt relative to its earnings, we calculate its net debt divided by its earnings before interest, tax, depreciation, and amortization (EBITDA) and its earnings before interest and tax (EBIT) divided by its interest expense (its interest cover). This way, we consider both the absolute quantum of the debt, as well as the interest rates paid on it.
With a net debt to EBITDA ratio of 6.2, it's fair to say HK Electric Investments and HK Electric Investments does have a significant amount of debt. However, its interest coverage of 5.9 is reasonably strong, which is a good sign. We saw HK Electric Investments and HK Electric Investments grow its EBIT by 2.5% in the last twelve months. That's far from incredible but it is a good thing, when it comes to paying off debt. When analysing debt levels, the balance sheet is the obvious place to start. But ultimately the future profitability of the business will decide if HK Electric Investments and HK Electric Investments can strengthen its balance sheet over time. So if you want to see what the professionals think, you might find this free report on analyst profit forecasts to be interesting.
But our final consideration is also important, because a company cannot pay debt with paper profits; it needs cold hard cash. So the logical step is to look at the proportion of that EBIT that is matched by actual free cash flow. In the last three years, HK Electric Investments and HK Electric Investments's free cash flow amounted to 23% of its EBIT, less than we'd expect. That's not great, when it comes to paying down debt.
Our View
Mulling over HK Electric Investments and HK Electric Investments's attempt at managing its debt, based on its EBITDA,, we're certainly not enthusiastic. Having said that, its ability to cover its interest expense with its EBIT isn't such a worry. It's also worth noting that HK Electric Investments and HK Electric Investments is in the Electric Utilities industry, which is often considered to be quite defensive. Looking at the bigger picture, it seems clear to us that HK Electric Investments and HK Electric Investments's use of debt is creating risks for the company. If all goes well, that should boost returns, but on the flip side, the risk of permanent capital loss is elevated by the debt. The balance sheet is clearly the area to focus on when you are analysing debt. However, not all investment risk resides within the balance sheet - far from it. Case in point: We've spotted 2 warning signs for HK Electric Investments and HK Electric Investments you should be aware of.
If you're interested in investing in businesses that can grow profits without the burden of debt, then check out this free list of growing businesses that have net cash on the balance sheet.
Have feedback on this article? Concerned about the content? Get in touch with us directly. Alternatively, email editorial-team (at) simplywallst.com.
This article by Simply Wall St is general in nature. We provide commentary based on historical data and analyst forecasts only using an unbiased methodology and our articles are not intended to be financial advice. It does not constitute a recommendation to buy or sell any stock, and does not take account of your objectives, or your financial situation. We aim to bring you long-term focused analysis driven by fundamental data. Note that our analysis may not factor in the latest price-sensitive company announcements or qualitative material. Simply Wall St has no position in any stocks mentioned.
伯克希尔哈撒韦的外部基金经理理想汽车·卢直言不讳地说,最大的投资风险不是价格的波动,而是你是否会遭受永久性的资本损失。因此,当你考虑到任何一只股票的风险有多大时,你需要考虑债务可能是显而易见的,因为太多的债务可能会让一家公司倒闭。重要的是港灯-SS有限公司(HKG:2638)确实有债务。但真正的问题是,这笔债务是否让该公司面临风险。
债务在什么时候是危险的?
债务帮助企业,直到企业难以偿还债务,无论是用新资本还是用自由现金流。资本主义的一部分是“创造性破坏”的过程,破产的企业被银行家无情地清算。然而,一种更常见(但仍令人痛苦)的情景是,它不得不以低价筹集新的股本,从而永久性地稀释股东。然而,通过取代稀释,对于需要资本投资于高回报率增长的企业来说,债务可以成为一个非常好的工具。当我们检查债务水平时,我们首先同时考虑现金和债务水平。
查看我们对港灯-SS的最新分析
港灯-SS的债务是什么?
下图显示,截至2022年6月,港灯-SS的债务为497亿港元,高于一年内的464亿港元。净债务大致相同,因为它没有太多现金。
联交所:2638债转股历史2022年9月1日港灯-SS的债务一瞥
放大最新的资产负债表数据,我们可以看到,港灯-SS有68亿港元的负债在12个月内到期,而在这之后还有631亿港元的负债到期。作为这些债务的抵消,该公司有1.54亿港元的现金以及价值16.6亿港元的应收账款在12个月内到期。因此,该公司的负债总额为681亿港元,超过了现金和近期应收账款的总和。
当你考虑到这一缺口超过了该公司574亿港元的市值时,你很可能倾向于专心审查资产负债表。在该公司不得不迅速清理其资产负债表的情况下,股东似乎可能会遭受广泛的稀释。
为了评估一家公司的债务相对于它的收益,我们计算它的净债务除以它的利息、税项、折旧和摊销前收益(EBITDA)和它的利息和税前收益(EBIT)除以它的利息支出(它的利息覆盖)。这样,我们既考虑了债务的绝对量,也考虑了为其支付的利率。
港灯-SS的净债务与息税前摊销前利润之比为6.2,公平地说,他确实有大量的债务。然而,其5.9%的利息覆盖率相当强劲,这是一个好迹象。我们看到港灯-SS在过去12个月中息税前利润增长了2.5%。这并不令人难以置信,但在偿还债务方面,这是一件好事。在分析债务水平时,资产负债表显然是一个起点。但最终,该业务未来的盈利能力将决定港灯-SS能否随着时间的推移加强其资产负债表。因此,如果你想看看专业人士的想法,你可能会发现这份关于分析师利润预测的免费报告很有趣。
但我们的最后考虑也很重要,因为一家公司不能用账面利润来偿还债务;它需要冷硬现金。因此,合乎逻辑的一步是看看息税前利润与实际自由现金流相匹配的比例。在过去三年中,港灯-SS的自由现金流占其息税前利润的23%,低于我们的预期。当涉及到偿还债务时,这并不是很好。
我们的观点
考虑到港灯-SS基于息税折旧摊销前利润(EBITDA)管理其债务的尝试,我们肯定不是很热情。话虽如此,它用息税前利润来支付利息支出的能力并不是那么令人担忧。同样值得注意的是,港灯-SS在电力公用事业行业,这个行业通常被认为是相当防御性的。从更大的角度来看,我们似乎很清楚,港灯-SS的债务使用正在给公司带来风险。如果一切顺利,这应该会提高回报,但另一方面,债务增加了永久资本损失的风险。当你分析债务时,资产负债表显然是你关注的领域。然而,并非所有投资风险都存在于资产负债表中--远非如此。一个恰当的例子:我们发现了港灯-SS的2个警示标志你应该意识到。
如果你有兴趣投资于可以在没有债务负担的情况下增长利润的企业,那么看看这个免费资产负债表上有净现金的成长型企业名单。
对这篇文章有什么反馈吗?担心内容吗? 保持联系直接与我们联系。或者,也可以给编辑组发电子邮件,地址是implywallst.com。
本文由Simply Wall St.撰写,具有概括性。我们仅使用不偏不倚的方法提供基于历史数据和分析师预测的评论,我们的文章并不打算作为财务建议。它不构成买卖任何股票的建议,也没有考虑你的目标或你的财务状况。我们的目标是为您带来由基本面数据驱动的长期重点分析。请注意,我们的分析可能不会将最新的对价格敏感的公司公告或定性材料考虑在内。Simply Wall St.对上述任何一只股票都没有持仓。
moomoo是Moomoo Technologies Inc.公司提供的金融信息和交易应用程序。
在美国,moomoo上的投资产品和服务由Moomoo Financial Inc.提供,一家受美国证券交易委员会(SEC)监管的持牌主体。 Moomoo Financial Inc.是金融业监管局(FINRA)和证券投资者保护公司(SIPC)的成员。
在新加坡,moomoo上的投资产品和服务是通过Moomoo Financial Singapore Pte. Ltd.提供,该公司受新加坡金融管理局(MAS)监管(牌照号码︰CMS101000) ,持有资本市场服务牌照 (CMS) ,持有财务顾问豁免(Exempt Financial Adviser)资质。本内容未经新加坡金融管理局的审查。
在澳大利亚,moomoo上的金融产品和服务是通过Futu Securities (Australia) Ltd提供,该公司是受澳大利亚证券和投资委员会(ASIC)监管的澳大利亚金融服务许可机构(AFSL No. 224663)。请阅读并理解我们的《金融服务指南》、《条款与条件》、《隐私政策》和其他披露文件,这些文件可在我们的网站 https://www.moomoo.com/au中获取。
在加拿大,通过moomoo应用提供的仅限订单执行的券商服务由Moomoo Financial Canada Inc.提供,并受加拿大投资监管机构(CIRO)监管。
在马来西亚,moomoo上的投资产品和服务是通过Moomoo Securities Malaysia Sdn. Bhd. 提供,该公司受马来西亚证券监督委员会(SC)监管(牌照号码︰eCMSL/A0397/2024) ,持有资本市场服务牌照 (CMSL) 。本内容未经马来西亚证券监督委员会的审查。
Moomoo Technologies Inc., Moomoo Financial Inc., Moomoo Financial Singapore Pte. Ltd., Futu Securities (Australia) Ltd, Moomoo Financial Canada Inc.,和Moomoo Securities Malaysia Sdn. Bhd.是关联公司。
风险及免责提示
moomoo是Moomoo Technologies Inc.公司提供的金融信息和交易应用程序。
在美国,moomoo上的投资产品和服务由Moomoo Financial Inc.提供,一家受美国证券交易委员会(SEC)监管的持牌主体。 Moomoo Financial Inc.是金融业监管局(FINRA)和证券投资者保护公司(SIPC)的成员。
在新加坡,moomoo上的投资产品和服务是通过Moomoo Financial Singapore Pte. Ltd.提供,该公司受新加坡金融管理局(MAS)监管(牌照号码︰CMS101000) ,持有资本市场服务牌照 (CMS) ,持有财务顾问豁免(Exempt Financial Adviser)资质。本内容未经新加坡金融管理局的审查。
在澳大利亚,moomoo上的金融产品和服务是通过Futu Securities (Australia) Ltd提供,该公司是受澳大利亚证券和投资委员会(ASIC)监管的澳大利亚金融服务许可机构(AFSL No. 224663)。请阅读并理解我们的《金融服务指南》、《条款与条件》、《隐私政策》和其他披露文件,这些文件可在我们的网站 https://www.moomoo.com/au中获取。
在加拿大,通过moomoo应用提供的仅限订单执行的券商服务由Moomoo Financial Canada Inc.提供,并受加拿大投资监管机构(CIRO)监管。
在马来西亚,moomoo上的投资产品和服务是通过Moomoo Securities Malaysia Sdn. Bhd. 提供,该公司受马来西亚证券监督委员会(SC)监管(牌照号码︰eCMSL/A0397/2024) ,持有资本市场服务牌照 (CMSL) 。本内容未经马来西亚证券监督委员会的审查。
Moomoo Technologies Inc., Moomoo Financial Inc., Moomoo Financial Singapore Pte. Ltd., Futu Securities (Australia) Ltd, Moomoo Financial Canada Inc.,和Moomoo Securities Malaysia Sdn. Bhd.是关联公司。
- 分享到weixin
- 分享到qq
- 分享到facebook
- 分享到twitter
- 分享到微博
- 粘贴板
使用浏览器的分享功能,分享给你的好友吧