
-
市场
-
产品
-
资讯
-
Moo社区
-
课堂
-
查看更多
-
功能介绍
-
费用费用透明,无最低余额限制
投资选择、功能介绍、费用相关信息由Moomoo Financial Inc.提供
- English
- 中文繁體
- 中文简体
- 深色
- 浅色
Is Grand Pharmaceutical Group Limited's (HKG:512) Stock's Recent Performance A Reflection Of Its Financial Health?
Is Grand Pharmaceutical Group Limited's (HKG:512) Stock's Recent Performance A Reflection Of Its Financial Health?
Most readers would already know that Grand Pharmaceutical Group's (HKG:512) stock increased by 4.6% over the past three months. Given its impressive performance, we decided to study the company's key financial indicators as a company's long-term fundamentals usually dictate market outcomes. Particularly, we will be paying attention to Grand Pharmaceutical Group's ROE today.
ROE or return on equity is a useful tool to assess how effectively a company can generate returns on the investment it received from its shareholders. Simply put, it is used to assess the profitability of a company in relation to its equity capital.
See our latest analysis for Grand Pharmaceutical Group
How Do You Calculate Return On Equity?
ROE can be calculated by using the formula:
Return on Equity = Net Profit (from continuing operations) ÷ Shareholders' Equity
So, based on the above formula, the ROE for Grand Pharmaceutical Group is:
14% = HK$1.9b ÷ HK$14b (Based on the trailing twelve months to June 2022).
The 'return' is the amount earned after tax over the last twelve months. One way to conceptualize this is that for each HK$1 of shareholders' capital it has, the company made HK$0.14 in profit.
What Is The Relationship Between ROE And Earnings Growth?
So far, we've learned that ROE is a measure of a company's profitability. Based on how much of its profits the company chooses to reinvest or "retain", we are then able to evaluate a company's future ability to generate profits. Assuming everything else remains unchanged, the higher the ROE and profit retention, the higher the growth rate of a company compared to companies that don't necessarily bear these characteristics.
Grand Pharmaceutical Group's Earnings Growth And 14% ROE
To start with, Grand Pharmaceutical Group's ROE looks acceptable. On comparing with the average industry ROE of 11% the company's ROE looks pretty remarkable. This probably laid the ground for Grand Pharmaceutical Group's significant 34% net income growth seen over the past five years. However, there could also be other causes behind this growth. Such as - high earnings retention or an efficient management in place.
As a next step, we compared Grand Pharmaceutical Group's net income growth with the industry, and pleasingly, we found that the growth seen by the company is higher than the average industry growth of 12%.
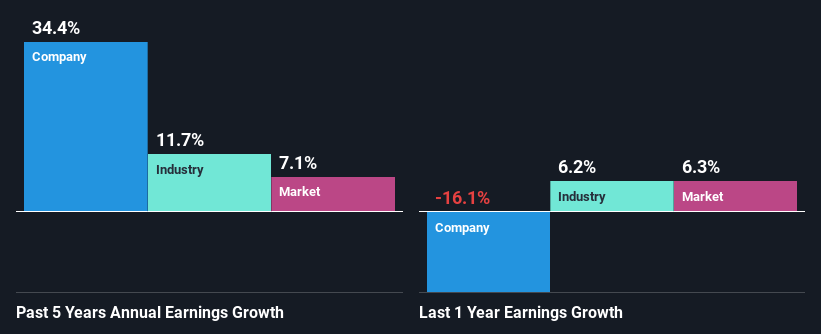 SEHK:512 Past Earnings Growth August 26th 2022
Earnings growth is a huge factor in stock valuation. It's important for an investor to know whether the market has priced in the company's expected earnings growth (or decline). This then helps them determine if the stock is placed for a bright or bleak future. What is 512 worth today? The intrinsic value infographic in our free research report helps visualize whether 512 is currently mispriced by the market.
Is Grand Pharmaceutical Group Efficiently Re-investing Its Profits?
Grand Pharmaceutical Group's three-year median payout ratio to shareholders is 21%, which is quite low. This implies that the company is retaining 79% of its profits. So it seems like the management is reinvesting profits heavily to grow its business and this reflects in its earnings growth number.
Additionally, Grand Pharmaceutical Group has paid dividends over a period of three years which means that the company is pretty serious about sharing its profits with shareholders.
Conclusion
In total, we are pretty happy with Grand Pharmaceutical Group's performance. In particular, it's great to see that the company is investing heavily into its business and along with a high rate of return, that has resulted in a sizeable growth in its earnings. If the company continues to grow its earnings the way it has, that could have a positive impact on its share price given how earnings per share influence long-term share prices. Remember, the price of a stock is also dependent on the perceived risk. Therefore investors must keep themselves informed about the risks involved before investing in any company. Our risks dashboard will have the 1 risk we have identified for Grand Pharmaceutical Group.
Have feedback on this article? Concerned about the content? Get in touch with us directly. Alternatively, email editorial-team (at) simplywallst.com.
This article by Simply Wall St is general in nature. We provide commentary based on historical data and analyst forecasts only using an unbiased methodology and our articles are not intended to be financial advice. It does not constitute a recommendation to buy or sell any stock, and does not take account of your objectives, or your financial situation. We aim to bring you long-term focused analysis driven by fundamental data. Note that our analysis may not factor in the latest price-sensitive company announcements or qualitative material. Simply Wall St has no position in any stocks mentioned.
大多数读者应该已经知道,大药业集团(HKG:512)的股票在过去三个月里上涨了4.6%。鉴于其令人印象深刻的表现,我们决定研究该公司的关键财务指标,因为公司的长期基本面通常决定市场结果。特别是今天我们将关注大药业集团的净资产收益率。
净资产收益率,即股本回报率,是评估一家公司从股东那里获得投资回报的有效程度的有用工具。简而言之,它是用来评估一家公司相对于其权益资本的盈利能力。
查看我们对大药业集团的最新分析
你如何计算股本回报率?
可使用以下公式计算净资产收益率:
股本回报率=(持续经营的)净利润?股东权益
因此,根据上述公式,大药业集团的净资产收益率为:
14%=19亿港元×140亿港元(根据截至2022年6月的过去12个月计算)。
“报税表”是过去12个月的税后收入。一种将其概念化的方法是,公司每持有1港元的股东资本,就能获得0.14港元的利润。
净资产收益率与盈利增长之间有什么关系?
到目前为止,我们了解到净资产收益率是衡量一家公司盈利能力的指标。根据公司选择再投资或“保留”多少利润,我们就能够评估一家公司未来产生利润的能力。假设其他条件不变,净资产收益率和利润保留率越高,与不一定具有这些特征的公司相比,公司的增长率就越高。
大药业集团的盈利增长和14%的净资产收益率
首先,大药业集团的净资产收益率看起来可以接受。与11%的行业平均净资产收益率相比,该公司的净资产收益率看起来相当惊人。这可能为大药业集团在过去五年中实现34%的净利润显著增长奠定了基础。然而,这种增长背后也可能有其他原因。例如-高收益留存或有效的管理到位。
作为下一步,我们将大药业集团的净收入增长与行业进行了比较,令人欣喜的是,我们发现该公司看到的增长高于行业平均12%的增长。
联交所:512过去盈利增长2022年8月26日盈利增长是股票估值的一个重要因素。对于投资者来说,重要的是知道市场是否已经消化了公司预期的收益增长(或下降)。这有助于他们确定这只股票是为光明还是黯淡的未来做准备。今天512值多少钱?我们免费研究报告中的内在价值信息图有助于直观地了解512目前是否被市场错误定价。
大药业集团是否有效地对其利润进行了再投资?
大药业集团对股东的三年派息率中值为21%,相当低。这意味着该公司将保留79%的利润。因此,管理层似乎正在对利润进行大量再投资,以增长业务,这反映在其收益增长数字上。
此外,大药业集团在三年内派发了股息,这意味着该公司对与股东分享利润相当认真。
结论
总体而言,我们对大药业集团的表现相当满意。特别是,很高兴看到该公司在业务上投入了大量资金,并获得了高回报率,这导致了其收益的可观增长。如果该公司继续以目前的方式增长收益,考虑到每股收益对长期股价的影响,这可能会对其股价产生积极影响。记住,股票的价格也取决于感知到的风险。因此,投资者在投资任何公司之前,必须随时了解所涉及的风险。我们的风险控制面板将包含我们为Grand Pharmtics Group确定的1个风险。
对这篇文章有什么反馈吗?担心内容吗? 保持联系直接与我们联系。或者,也可以给编辑组发电子邮件,地址是implywallst.com。
本文由Simply Wall St.撰写,具有概括性。我们仅使用不偏不倚的方法提供基于历史数据和分析师预测的评论,我们的文章并不打算作为财务建议。它不构成买卖任何股票的建议,也没有考虑你的目标或你的财务状况。我们的目标是为您带来由基本面数据驱动的长期重点分析。请注意,我们的分析可能不会将最新的对价格敏感的公司公告或定性材料考虑在内。Simply Wall St.对上述任何一只股票都没有持仓。
moomoo是Moomoo Technologies Inc.公司提供的金融信息和交易应用程序。
在美国,moomoo上的投资产品和服务由Moomoo Financial Inc.提供,一家受美国证券交易委员会(SEC)监管的持牌主体。 Moomoo Financial Inc.是金融业监管局(FINRA)和证券投资者保护公司(SIPC)的成员。
在新加坡,moomoo上的投资产品和服务是通过Moomoo Financial Singapore Pte. Ltd.提供,该公司受新加坡金融管理局(MAS)监管(牌照号码︰CMS101000) ,持有资本市场服务牌照 (CMS) ,持有财务顾问豁免(Exempt Financial Adviser)资质。本内容未经新加坡金融管理局的审查。
在澳大利亚,moomoo上的金融产品和服务是通过Futu Securities (Australia) Ltd提供,该公司是受澳大利亚证券和投资委员会(ASIC)监管的澳大利亚金融服务许可机构(AFSL No. 224663)。请阅读并理解我们的《金融服务指南》、《条款与条件》、《隐私政策》和其他披露文件,这些文件可在我们的网站 https://www.moomoo.com/au中获取。
在加拿大,通过moomoo应用提供的仅限订单执行的券商服务由Moomoo Financial Canada Inc.提供,并受加拿大投资监管机构(CIRO)监管。
在马来西亚,moomoo上的投资产品和服务是通过Moomoo Securities Malaysia Sdn. Bhd. 提供,该公司受马来西亚证券监督委员会(SC)监管(牌照号码︰eCMSL/A0397/2024) ,持有资本市场服务牌照 (CMSL) 。本内容未经马来西亚证券监督委员会的审查。
Moomoo Technologies Inc., Moomoo Financial Inc., Moomoo Financial Singapore Pte. Ltd., Futu Securities (Australia) Ltd, Moomoo Financial Canada Inc.,和Moomoo Securities Malaysia Sdn. Bhd.是关联公司。
风险及免责提示
moomoo是Moomoo Technologies Inc.公司提供的金融信息和交易应用程序。
在美国,moomoo上的投资产品和服务由Moomoo Financial Inc.提供,一家受美国证券交易委员会(SEC)监管的持牌主体。 Moomoo Financial Inc.是金融业监管局(FINRA)和证券投资者保护公司(SIPC)的成员。
在新加坡,moomoo上的投资产品和服务是通过Moomoo Financial Singapore Pte. Ltd.提供,该公司受新加坡金融管理局(MAS)监管(牌照号码︰CMS101000) ,持有资本市场服务牌照 (CMS) ,持有财务顾问豁免(Exempt Financial Adviser)资质。本内容未经新加坡金融管理局的审查。
在澳大利亚,moomoo上的金融产品和服务是通过Futu Securities (Australia) Ltd提供,该公司是受澳大利亚证券和投资委员会(ASIC)监管的澳大利亚金融服务许可机构(AFSL No. 224663)。请阅读并理解我们的《金融服务指南》、《条款与条件》、《隐私政策》和其他披露文件,这些文件可在我们的网站 https://www.moomoo.com/au中获取。
在加拿大,通过moomoo应用提供的仅限订单执行的券商服务由Moomoo Financial Canada Inc.提供,并受加拿大投资监管机构(CIRO)监管。
在马来西亚,moomoo上的投资产品和服务是通过Moomoo Securities Malaysia Sdn. Bhd. 提供,该公司受马来西亚证券监督委员会(SC)监管(牌照号码︰eCMSL/A0397/2024) ,持有资本市场服务牌照 (CMSL) 。本内容未经马来西亚证券监督委员会的审查。
Moomoo Technologies Inc., Moomoo Financial Inc., Moomoo Financial Singapore Pte. Ltd., Futu Securities (Australia) Ltd, Moomoo Financial Canada Inc.,和Moomoo Securities Malaysia Sdn. Bhd.是关联公司。
- 分享到weixin
- 分享到qq
- 分享到facebook
- 分享到twitter
- 分享到微博
- 粘贴板
使用浏览器的分享功能,分享给你的好友吧