
-
市场
-
产品
-
资讯
-
Moo社区
-
课堂
-
查看更多
-
功能介绍
-
费用费用透明,无最低余额限制
投资选择、功能介绍、费用相关信息由Moomoo Financial Inc.提供
- English
- 中文繁體
- 中文简体
- 深色
- 浅色
Investors in Zoomlion Heavy Industry Science and Technology (SZSE:000157) Have Made a Notable Return of 58% Over the Past Five Years
Investors in Zoomlion Heavy Industry Science and Technology (SZSE:000157) Have Made a Notable Return of 58% Over the Past Five Years
When we invest, we're generally looking for stocks that outperform the market average. And the truth is, you can make significant gains if you buy good quality businesses at the right price. To wit, the Zoomlion Heavy Industry Science and Technology share price has climbed 28% in five years, easily topping the market return of 8.2% (ignoring dividends).
Let's take a look at the underlying fundamentals over the longer term, and see if they've been consistent with shareholders returns.
Check out our latest analysis for Zoomlion Heavy Industry Science and Technology
To paraphrase Benjamin Graham: Over the short term the market is a voting machine, but over the long term it's a weighing machine. By comparing earnings per share (EPS) and share price changes over time, we can get a feel for how investor attitudes to a company have morphed over time.
During the last half decade, Zoomlion Heavy Industry Science and Technology became profitable. That would generally be considered a positive, so we'd expect the share price to be up. Given that the company made a profit three years ago, but not five years ago, it is worth looking at the share price returns over the last three years, too. Indeed, the Zoomlion Heavy Industry Science and Technology share price has gained 10% in three years. Meanwhile, EPS is up 18% per year. This EPS growth is higher than the 3% average annual increase in the share price over the same three years. Therefore, it seems the market has moderated its expectations for growth, somewhat. This cautious sentiment is reflected in its (fairly low) P/E ratio of 10.74.
The company's earnings per share (over time) is depicted in the image below (click to see the exact numbers).
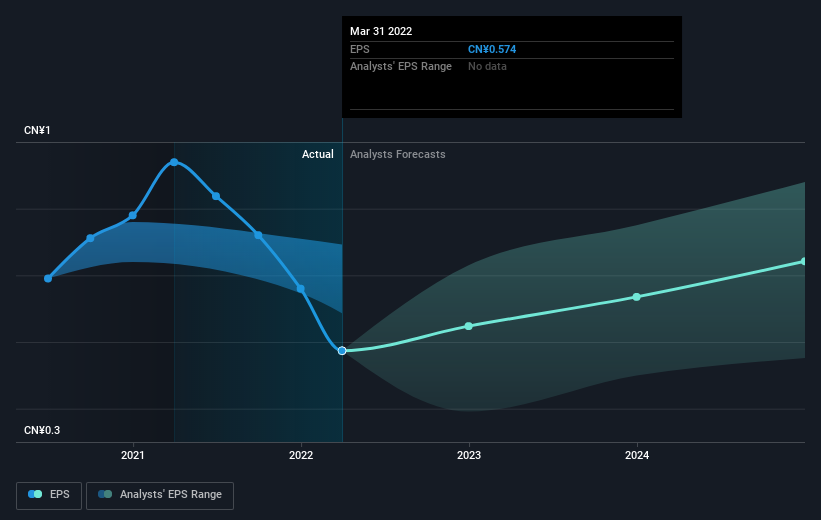 SZSE:000157 Earnings Per Share Growth August 24th 2022
It might be well worthwhile taking a look at our free report on Zoomlion Heavy Industry Science and Technology's earnings, revenue and cash flow.
What About Dividends?
It is important to consider the total shareholder return, as well as the share price return, for any given stock. The TSR incorporates the value of any spin-offs or discounted capital raisings, along with any dividends, based on the assumption that the dividends are reinvested. So for companies that pay a generous dividend, the TSR is often a lot higher than the share price return. We note that for Zoomlion Heavy Industry Science and Technology the TSR over the last 5 years was 58%, which is better than the share price return mentioned above. The dividends paid by the company have thusly boosted the total shareholder return.
A Different Perspective
We regret to report that Zoomlion Heavy Industry Science and Technology shareholders are down 22% for the year (even including dividends). Unfortunately, that's worse than the broader market decline of 8.5%. Having said that, it's inevitable that some stocks will be oversold in a falling market. The key is to keep your eyes on the fundamental developments. Longer term investors wouldn't be so upset, since they would have made 10%, each year, over five years. It could be that the recent sell-off is an opportunity, so it may be worth checking the fundamental data for signs of a long term growth trend. While it is well worth considering the different impacts that market conditions can have on the share price, there are other factors that are even more important. Take risks, for example - Zoomlion Heavy Industry Science and Technology has 1 warning sign we think you should be aware of.
We will like Zoomlion Heavy Industry Science and Technology better if we see some big insider buys. While we wait, check out this free list of growing companies with considerable, recent, insider buying.
Please note, the market returns quoted in this article reflect the market weighted average returns of stocks that currently trade on CN exchanges.
Have feedback on this article? Concerned about the content? Get in touch with us directly. Alternatively, email editorial-team (at) simplywallst.com.
This article by Simply Wall St is general in nature. We provide commentary based on historical data and analyst forecasts only using an unbiased methodology and our articles are not intended to be financial advice. It does not constitute a recommendation to buy or sell any stock, and does not take account of your objectives, or your financial situation. We aim to bring you long-term focused analysis driven by fundamental data. Note that our analysis may not factor in the latest price-sensitive company announcements or qualitative material. Simply Wall St has no position in any stocks mentioned.
当我们投资时,我们通常会寻找表现优于市场平均水平的股票。事实是,如果你以合适的价格收购质量好的企业,你可以获得巨大的收益。换句话说,中联重科的股价在五年内攀升了28%,轻松超过了8.2%的市场回报率(不考虑股息)。
让我们来看看较长期的基本基本面,看看它们是否与股东回报一致。
看看我们对中联重科的最新分析
本杰明·格雷厄姆(Benjamin Graham)的原话是:短期内,市场是一台投票机,但从长远来看,它是一台称重机。通过比较每股收益(EPS)和股价随时间的变化,我们可以感受到投资者对一家公司的态度随着时间的推移发生了怎样的变化。
在过去的五年里,中联重科实现了盈利。这通常会被认为是积极的,所以我们预计股价会上涨。考虑到该公司三年前实现了盈利,但不是五年前,过去三年的股价回报也值得一看。事实上,中联重科的股价在三年内上涨了10%。与此同时,每股收益以每年18%的速度增长。这一每股收益增长高于同样三年来股价平均每年3%的增幅。因此,市场似乎在一定程度上降低了对增长的预期。这种谨慎的情绪反映在(相当低的)市盈率10.74。
该公司的每股收益(在一段时间内)如下图所示(点击查看具体数字)。
上交所:2022年8月24日每股收益增长000157也许很值得一看我们的免费中联重科的收入、收入和现金流报告。
那股息呢?
重要的是要考虑任何给定股票的总股东回报以及股价回报。TSR包括任何剥离或贴现融资的价值,以及任何股息,基于股息再投资的假设。因此,对于支付丰厚股息的公司来说,TSR往往比股价回报高得多。我们注意到,中联重科在过去5年的总回报率为58%,好于上文提到的股价回报率。该公司支付的股息因此提振了总计股东回报。
不同的视角
我们遗憾地报告,中联重科的股东今年以来下跌了22%(即使包括股息)。不幸的是,这比大盘8.5%的跌幅还要糟糕。话虽如此,在下跌的市场中,一些股票不可避免地会被超卖。关键是要密切关注基本面的发展。较长期的投资者不会如此沮丧,因为他们在五年内每年会获得10%的收益。最近的抛售可能是一个机会,因此可能值得查看基本面数据,以寻找长期增长趋势的迹象。虽然值得考虑市场状况对股价可能产生的不同影响,但还有其他更重要的因素。以冒险为例-中联重科有1个警告标志我们认为你应该意识到。
如果我们看到一些大的内部收购,我们会更喜欢中联重科。在我们等待的时候,看看这个免费最近有大量内幕收购的成长型公司名单。
请注意,本文引用的市场回报反映了目前在CN交易所交易的股票的市场加权平均回报。
对这篇文章有什么反馈吗?担心内容吗? 保持联系直接与我们联系。或者,也可以给编辑组发电子邮件,地址是implywallst.com。
本文由Simply Wall St.撰写,具有概括性。我们仅使用不偏不倚的方法提供基于历史数据和分析师预测的评论,我们的文章并不打算作为财务建议。它不构成买卖任何股票的建议,也没有考虑你的目标或你的财务状况。我们的目标是为您带来由基本面数据驱动的长期重点分析。请注意,我们的分析可能不会将最新的对价格敏感的公司公告或定性材料考虑在内。Simply Wall St.对上述任何一只股票都没有持仓。
moomoo是Moomoo Technologies Inc.公司提供的金融信息和交易应用程序。
在美国,moomoo上的投资产品和服务由Moomoo Financial Inc.提供,一家受美国证券交易委员会(SEC)监管的持牌主体。 Moomoo Financial Inc.是金融业监管局(FINRA)和证券投资者保护公司(SIPC)的成员。
在新加坡,moomoo上的投资产品和服务是通过Moomoo Financial Singapore Pte. Ltd.提供,该公司受新加坡金融管理局(MAS)监管(牌照号码︰CMS101000) ,持有资本市场服务牌照 (CMS) ,持有财务顾问豁免(Exempt Financial Adviser)资质。本内容未经新加坡金融管理局的审查。
在澳大利亚,moomoo上的金融产品和服务是通过Futu Securities (Australia) Ltd提供,该公司是受澳大利亚证券和投资委员会(ASIC)监管的澳大利亚金融服务许可机构(AFSL No. 224663)。请阅读并理解我们的《金融服务指南》、《条款与条件》、《隐私政策》和其他披露文件,这些文件可在我们的网站 https://www.moomoo.com/au中获取。
在加拿大,通过moomoo应用提供的仅限订单执行的券商服务由Moomoo Financial Canada Inc.提供,并受加拿大投资监管机构(CIRO)监管。
在马来西亚,moomoo上的投资产品和服务是通过Moomoo Securities Malaysia Sdn. Bhd. 提供,该公司受马来西亚证券监督委员会(SC)监管(牌照号码︰eCMSL/A0397/2024) ,持有资本市场服务牌照 (CMSL) 。本内容未经马来西亚证券监督委员会的审查。
Moomoo Technologies Inc., Moomoo Financial Inc., Moomoo Financial Singapore Pte. Ltd., Futu Securities (Australia) Ltd, Moomoo Financial Canada Inc.,和Moomoo Securities Malaysia Sdn. Bhd.是关联公司。
风险及免责提示
moomoo是Moomoo Technologies Inc.公司提供的金融信息和交易应用程序。
在美国,moomoo上的投资产品和服务由Moomoo Financial Inc.提供,一家受美国证券交易委员会(SEC)监管的持牌主体。 Moomoo Financial Inc.是金融业监管局(FINRA)和证券投资者保护公司(SIPC)的成员。
在新加坡,moomoo上的投资产品和服务是通过Moomoo Financial Singapore Pte. Ltd.提供,该公司受新加坡金融管理局(MAS)监管(牌照号码︰CMS101000) ,持有资本市场服务牌照 (CMS) ,持有财务顾问豁免(Exempt Financial Adviser)资质。本内容未经新加坡金融管理局的审查。
在澳大利亚,moomoo上的金融产品和服务是通过Futu Securities (Australia) Ltd提供,该公司是受澳大利亚证券和投资委员会(ASIC)监管的澳大利亚金融服务许可机构(AFSL No. 224663)。请阅读并理解我们的《金融服务指南》、《条款与条件》、《隐私政策》和其他披露文件,这些文件可在我们的网站 https://www.moomoo.com/au中获取。
在加拿大,通过moomoo应用提供的仅限订单执行的券商服务由Moomoo Financial Canada Inc.提供,并受加拿大投资监管机构(CIRO)监管。
在马来西亚,moomoo上的投资产品和服务是通过Moomoo Securities Malaysia Sdn. Bhd. 提供,该公司受马来西亚证券监督委员会(SC)监管(牌照号码︰eCMSL/A0397/2024) ,持有资本市场服务牌照 (CMSL) 。本内容未经马来西亚证券监督委员会的审查。
Moomoo Technologies Inc., Moomoo Financial Inc., Moomoo Financial Singapore Pte. Ltd., Futu Securities (Australia) Ltd, Moomoo Financial Canada Inc.,和Moomoo Securities Malaysia Sdn. Bhd.是关联公司。
- 分享到weixin
- 分享到qq
- 分享到facebook
- 分享到twitter
- 分享到微博
- 粘贴板
使用浏览器的分享功能,分享给你的好友吧