
-
市场
-
产品
-
资讯
-
Moo社区
-
课堂
-
查看更多
-
功能介绍
-
费用费用透明,无最低余额限制
投资选择、功能介绍、费用相关信息由Moomoo Financial Inc.提供
- English
- 中文繁體
- 中文简体
- 深色
- 浅色
Chengdu Leejun Industrial's (SZSE:002651) Earnings Growth Rate Lags the 27% CAGR Delivered to Shareholders
Chengdu Leejun Industrial's (SZSE:002651) Earnings Growth Rate Lags the 27% CAGR Delivered to Shareholders
By buying an index fund, you can roughly match the market return with ease. But if you pick the right individual stocks, you could make more than that. Just take a look at Chengdu Leejun Industrial Co., Ltd. (SZSE:002651), which is up 96%, over three years, soundly beating the market return of 31% (not including dividends).
Since the long term performance has been good but there's been a recent pullback of 4.0%, let's check if the fundamentals match the share price.
See our latest analysis for Chengdu Leejun Industrial
While the efficient markets hypothesis continues to be taught by some, it has been proven that markets are over-reactive dynamic systems, and investors are not always rational. One way to examine how market sentiment has changed over time is to look at the interaction between a company's share price and its earnings per share (EPS).
During three years of share price growth, Chengdu Leejun Industrial achieved compound earnings per share growth of 12% per year. This EPS growth is lower than the 25% average annual increase in the share price. This indicates that the market is feeling more optimistic on the stock, after the last few years of progress. It is quite common to see investors become enamoured with a business, after a few years of solid progress. This favorable sentiment is reflected in its (fairly optimistic) P/E ratio of 46.66.
The graphic below depicts how EPS has changed over time (unveil the exact values by clicking on the image).
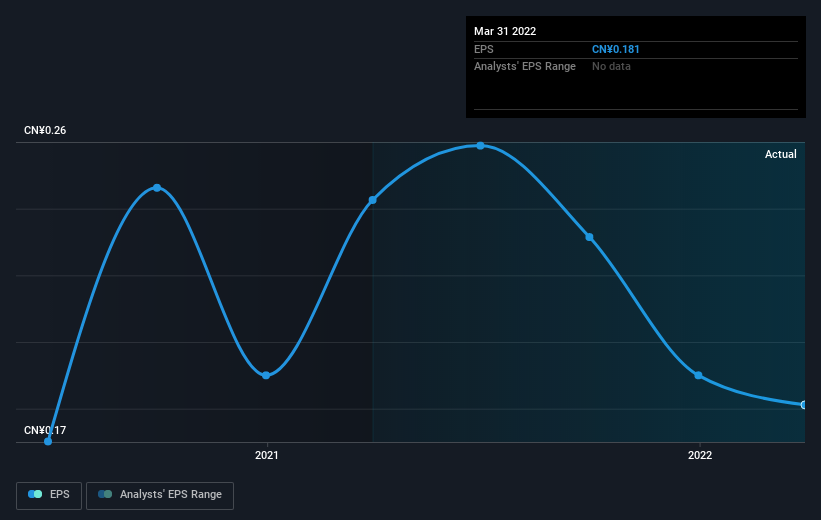 SZSE:002651 Earnings Per Share Growth August 16th 2022
This free interactive report on Chengdu Leejun Industrial's earnings, revenue and cash flow is a great place to start, if you want to investigate the stock further.
What About Dividends?
It is important to consider the total shareholder return, as well as the share price return, for any given stock. The TSR incorporates the value of any spin-offs or discounted capital raisings, along with any dividends, based on the assumption that the dividends are reinvested. It's fair to say that the TSR gives a more complete picture for stocks that pay a dividend. We note that for Chengdu Leejun Industrial the TSR over the last 3 years was 103%, which is better than the share price return mentioned above. The dividends paid by the company have thusly boosted the total shareholder return.
A Different Perspective
We regret to report that Chengdu Leejun Industrial shareholders are down 43% for the year (even including dividends). Unfortunately, that's worse than the broader market decline of 8.2%. However, it could simply be that the share price has been impacted by broader market jitters. It might be worth keeping an eye on the fundamentals, in case there's a good opportunity. Regrettably, last year's performance caps off a bad run, with the shareholders facing a total loss of 0.2% per year over five years. Generally speaking long term share price weakness can be a bad sign, though contrarian investors might want to research the stock in hope of a turnaround. I find it very interesting to look at share price over the long term as a proxy for business performance. But to truly gain insight, we need to consider other information, too. Case in point: We've spotted 1 warning sign for Chengdu Leejun Industrial you should be aware of.
But note: Chengdu Leejun Industrial may not be the best stock to buy. So take a peek at this free list of interesting companies with past earnings growth (and further growth forecast).
Please note, the market returns quoted in this article reflect the market weighted average returns of stocks that currently trade on CN exchanges.
Have feedback on this article? Concerned about the content? Get in touch with us directly. Alternatively, email editorial-team (at) simplywallst.com.
This article by Simply Wall St is general in nature. We provide commentary based on historical data and analyst forecasts only using an unbiased methodology and our articles are not intended to be financial advice. It does not constitute a recommendation to buy or sell any stock, and does not take account of your objectives, or your financial situation. We aim to bring you long-term focused analysis driven by fundamental data. Note that our analysis may not factor in the latest price-sensitive company announcements or qualitative material. Simply Wall St has no position in any stocks mentioned.
通过购买指数基金,你可以轻松地大致匹配市场回报。但如果你选择了正确的个股,你可以赚得更多。只要看一看成都乐骏实业有限公司(上证所:002651),三年来上涨了96%,远远超过了31%的市场回报率(不包括股息)。
由于长期表现良好,但最近出现了4.0%的回调,让我们看看基本面是否与股价匹配。
查看我们对成都利骏实业的最新分析
虽然有效市场假说继续被一些人传授,但事实证明,市场是过度反应的动态系统,投资者并不总是理性的。考察市场情绪如何随时间变化的一种方法是观察一家公司的股价和每股收益(EPS)之间的相互作用。
在三年的股价增长中,成都乐骏实业实现了每股收益年均12%的复合增长。这一每股收益增幅低于该公司股价25%的年均增幅。这表明,在经历了过去几年的上涨后,市场对该股的看法变得更加乐观。在经历了几年的稳健发展后,投资者对一家企业变得痴迷是很常见的。这种有利的情绪反映在其(相当乐观的)市盈率为46.66。
下图描述了EPS是如何随着时间的推移而变化的(通过单击图像来揭示确切的值)。
上交所:2022年8月16日每股收益增长002651这免费如果你想进一步调查该股,成都乐骏实业的收益、收入和现金流互动报告是一个很好的起点。
那股息呢?
重要的是要考虑任何给定股票的总股东回报以及股价回报。TSR包括任何剥离或贴现融资的价值,以及任何股息,基于股息再投资的假设。公平地说,TSR为支付股息的股票提供了更完整的图景。我们注意到,成都乐骏实业过去3年的TSR为103%,好于上述股价回报率。该公司支付的股息因此提振了总计股东回报。
不同的视角
我们遗憾地报告,成都乐骏实业股东今年以来下跌了43%(即使包括股息)。不幸的是,这比大盘8.2%的跌幅还要糟糕。然而,这可能只是因为股价受到了更广泛的市场紧张情绪的影响。也许有必要关注基本面,以防出现良机。令人遗憾的是,去年的业绩为糟糕的表现画上了句号,股东们在五年内面临着每年0.2%的总亏损。一般来说,股价长期疲软可能是一个坏信号,尽管反向投资者可能会希望研究这只股票,希望它能好转。我发现,把股价作为衡量企业业绩的长期指标是非常有趣的。但为了真正获得洞察力,我们还需要考虑其他信息。一个恰当的例子:我们发现了成都乐骏实业1个警示标志你应该意识到。
但请注意:成都乐骏实业可能不是最值得买入的股票。所以让我们来看看这个免费过去有盈利增长(以及进一步增长预测)的有趣公司名单。
请注意,本文引用的市场回报反映了目前在CN交易所交易的股票的市场加权平均回报。
对这篇文章有什么反馈吗?担心内容吗? 保持联系直接与我们联系。或者,也可以给编辑组发电子邮件,地址是implywallst.com。
本文由Simply Wall St.撰写,具有概括性。我们仅使用不偏不倚的方法提供基于历史数据和分析师预测的评论,我们的文章并不打算作为财务建议。它不构成买卖任何股票的建议,也没有考虑你的目标或你的财务状况。我们的目标是为您带来由基本面数据驱动的长期重点分析。请注意,我们的分析可能不会将最新的对价格敏感的公司公告或定性材料考虑在内。Simply Wall St.对上述任何一只股票都没有持仓。
moomoo是Moomoo Technologies Inc.公司提供的金融信息和交易应用程序。
在美国,moomoo上的投资产品和服务由Moomoo Financial Inc.提供,一家受美国证券交易委员会(SEC)监管的持牌主体。 Moomoo Financial Inc.是金融业监管局(FINRA)和证券投资者保护公司(SIPC)的成员。
在新加坡,moomoo上的投资产品和服务是通过Moomoo Financial Singapore Pte. Ltd.提供,该公司受新加坡金融管理局(MAS)监管(牌照号码︰CMS101000) ,持有资本市场服务牌照 (CMS) ,持有财务顾问豁免(Exempt Financial Adviser)资质。本内容未经新加坡金融管理局的审查。
在澳大利亚,moomoo上的金融产品和服务是通过Futu Securities (Australia) Ltd提供,该公司是受澳大利亚证券和投资委员会(ASIC)监管的澳大利亚金融服务许可机构(AFSL No. 224663)。请阅读并理解我们的《金融服务指南》、《条款与条件》、《隐私政策》和其他披露文件,这些文件可在我们的网站 https://www.moomoo.com/au中获取。
在加拿大,通过moomoo应用提供的仅限订单执行的券商服务由Moomoo Financial Canada Inc.提供,并受加拿大投资监管机构(CIRO)监管。
在马来西亚,moomoo上的投资产品和服务是通过Moomoo Securities Malaysia Sdn. Bhd. 提供,该公司受马来西亚证券监督委员会(SC)监管(牌照号码︰eCMSL/A0397/2024) ,持有资本市场服务牌照 (CMSL) 。本内容未经马来西亚证券监督委员会的审查。
Moomoo Technologies Inc., Moomoo Financial Inc., Moomoo Financial Singapore Pte. Ltd., Futu Securities (Australia) Ltd, Moomoo Financial Canada Inc.,和Moomoo Securities Malaysia Sdn. Bhd.是关联公司。
风险及免责提示
moomoo是Moomoo Technologies Inc.公司提供的金融信息和交易应用程序。
在美国,moomoo上的投资产品和服务由Moomoo Financial Inc.提供,一家受美国证券交易委员会(SEC)监管的持牌主体。 Moomoo Financial Inc.是金融业监管局(FINRA)和证券投资者保护公司(SIPC)的成员。
在新加坡,moomoo上的投资产品和服务是通过Moomoo Financial Singapore Pte. Ltd.提供,该公司受新加坡金融管理局(MAS)监管(牌照号码︰CMS101000) ,持有资本市场服务牌照 (CMS) ,持有财务顾问豁免(Exempt Financial Adviser)资质。本内容未经新加坡金融管理局的审查。
在澳大利亚,moomoo上的金融产品和服务是通过Futu Securities (Australia) Ltd提供,该公司是受澳大利亚证券和投资委员会(ASIC)监管的澳大利亚金融服务许可机构(AFSL No. 224663)。请阅读并理解我们的《金融服务指南》、《条款与条件》、《隐私政策》和其他披露文件,这些文件可在我们的网站 https://www.moomoo.com/au中获取。
在加拿大,通过moomoo应用提供的仅限订单执行的券商服务由Moomoo Financial Canada Inc.提供,并受加拿大投资监管机构(CIRO)监管。
在马来西亚,moomoo上的投资产品和服务是通过Moomoo Securities Malaysia Sdn. Bhd. 提供,该公司受马来西亚证券监督委员会(SC)监管(牌照号码︰eCMSL/A0397/2024) ,持有资本市场服务牌照 (CMSL) 。本内容未经马来西亚证券监督委员会的审查。
Moomoo Technologies Inc., Moomoo Financial Inc., Moomoo Financial Singapore Pte. Ltd., Futu Securities (Australia) Ltd, Moomoo Financial Canada Inc.,和Moomoo Securities Malaysia Sdn. Bhd.是关联公司。
- 分享到weixin
- 分享到qq
- 分享到facebook
- 分享到twitter
- 分享到微博
- 粘贴板
使用浏览器的分享功能,分享给你的好友吧