
-
市场
-
产品
-
资讯
-
Moo社区
-
课堂
-
查看更多
-
功能介绍
-
费用费用透明,无最低余额限制
投资选择、功能介绍、费用相关信息由Moomoo Financial Inc.提供
- English
- 中文繁體
- 中文简体
- 深色
- 浅色
Some Investors May Be Worried About China Oriental Group's (HKG:581) Returns On Capital
Some Investors May Be Worried About China Oriental Group's (HKG:581) Returns On Capital
What are the early trends we should look for to identify a stock that could multiply in value over the long term? One common approach is to try and find a company with returns on capital employed (ROCE) that are increasing, in conjunction with a growing amount of capital employed. Put simply, these types of businesses are compounding machines, meaning they are continually reinvesting their earnings at ever-higher rates of return. Having said that, from a first glance at China Oriental Group (HKG:581) we aren't jumping out of our chairs at how returns are trending, but let's have a deeper look.
Understanding Return On Capital Employed (ROCE)
Just to clarify if you're unsure, ROCE is a metric for evaluating how much pre-tax income (in percentage terms) a company earns on the capital invested in its business. The formula for this calculation on China Oriental Group is:
Return on Capital Employed = Earnings Before Interest and Tax (EBIT) ÷ (Total Assets - Current Liabilities)
0.12 = CN¥3.0b ÷ (CN¥52b - CN¥27b) (Based on the trailing twelve months to December 2021).
Thus, China Oriental Group has an ROCE of 12%. In absolute terms, that's a pretty normal return, and it's somewhat close to the Metals and Mining industry average of 14%.
Check out our latest analysis for China Oriental Group
 SEHK:581 Return on Capital Employed August 4th 2022
Above you can see how the current ROCE for China Oriental Group compares to its prior returns on capital, but there's only so much you can tell from the past. If you'd like to see what analysts are forecasting going forward, you should check out our free report for China Oriental Group.
What Does the ROCE Trend For China Oriental Group Tell Us?
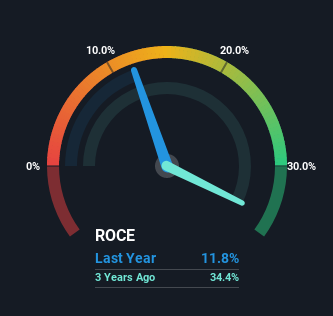
In terms of China Oriental Group's historical ROCE movements, the trend isn't fantastic. Over the last five years, returns on capital have decreased to 12% from 18% five years ago. Although, given both revenue and the amount of assets employed in the business have increased, it could suggest the company is investing in growth, and the extra capital has led to a short-term reduction in ROCE. And if the increased capital generates additional returns, the business, and thus shareholders, will benefit in the long run.
On a separate but related note, it's important to know that China Oriental Group has a current liabilities to total assets ratio of 51%, which we'd consider pretty high. This effectively means that suppliers (or short-term creditors) are funding a large portion of the business, so just be aware that this can introduce some elements of risk. Ideally we'd like to see this reduce as that would mean fewer obligations bearing risks.
In Conclusion...
While returns have fallen for China Oriental Group in recent times, we're encouraged to see that sales are growing and that the business is reinvesting in its operations. However, despite the promising trends, the stock has fallen 46% over the last five years, so there might be an opportunity here for astute investors. As a result, we'd recommend researching this stock further to uncover what other fundamentals of the business can show us.
If you want to continue researching China Oriental Group, you might be interested to know about the 1 warning sign that our analysis has discovered.
For those who like to invest in solid companies, check out this free list of companies with solid balance sheets and high returns on equity.
Have feedback on this article? Concerned about the content? Get in touch with us directly. Alternatively, email editorial-team (at) simplywallst.com.
This article by Simply Wall St is general in nature. We provide commentary based on historical data and analyst forecasts only using an unbiased methodology and our articles are not intended to be financial advice. It does not constitute a recommendation to buy or sell any stock, and does not take account of your objectives, or your financial situation. We aim to bring you long-term focused analysis driven by fundamental data. Note that our analysis may not factor in the latest price-sensitive company announcements or qualitative material. Simply Wall St has no position in any stocks mentioned.
我们应该寻找哪些早期趋势来识别一只可能在长期内成倍增值的股票?一种常见的方法是尝试找到一家拥有退货已使用资本(ROCE)正在增加,同时也在增长金额已动用资本的比例。简而言之,这些类型的企业是复利机器,这意味着它们不断地以越来越高的回报率对收益进行再投资。话虽如此,从第一眼看中国东方集团(HKG:581)我们不会因为回报率的趋势而从椅子上跳起来,但让我们更深入地看看。
了解资本回报率(ROCE)
如果您不确定,只需澄清一下,ROCE是一种评估公司投资于其业务的资本获得多少税前收入(按百分比计算)的指标。中国东方集团的这一计算公式为:
已动用资本回报率=息税前收益(EBIT)?(总资产-流动负债)
0.12=CN元3.0亿?(CN元52B-CN元27B)(根据截至2021年12月的往绩12个月计算).
因此,中国东方集团的净资产收益率为12%。按绝对值计算,这是相当正常的回报率,有点接近金属和矿业行业14%的平均水平。
查看我们对中国东方集团的最新分析
联交所:581已动用资本回报率2022年8月4日上图中,你可以看到中国东方集团目前的净资产收益率与之前的资本回报率相比如何,但你只能从过去知道这么多。如果您想查看分析师对未来的预测,您应该查看我们的免费为中国东方集团报道。
中国东方集团的ROCE趋势告诉我们什么?
就中国东方集团历史上的ROCE运动而言,这一趋势并不美妙。过去五年,资本回报率从五年前的18%降至12%。尽管,考虑到收入和业务中使用的资产数量都有所增加,这可能表明该公司正在投资于增长,而额外的资本导致了ROCE的短期下降。如果增加的资本产生额外的回报,从长远来看,企业和股东都将受益。
在另一个相关的问题上,重要的是要知道,中国东方集团的流动负债与总资产之比为51%,我们认为这个比率相当高。这实际上意味着供应商(或短期债权人)正在为很大一部分业务提供资金,因此只需意识到这可能会带来一些风险因素。理想情况下,我们希望看到这一比例降低,因为这将意味着承担风险的债务更少。
总之..。
虽然最近中国东方集团的回报率有所下降,但我们感到鼓舞的是,销售额在增长,该业务正在对其业务进行再投资。然而,尽管趋势看好,但该股在过去五年中下跌了46%,因此精明的投资者可能会有机会。因此,我们建议进一步研究这只股票,以揭示该业务的其他基本面可以向我们展示什么。
如果你想继续研究中国东方集团,你可能会有兴趣了解一下1个警告标志我们的分析发现。
对于那些喜欢投资于稳固的公司,看看这个免费资产负债表稳健、股本回报率高的公司名单。
对这篇文章有什么反馈吗?担心内容吗? 保持联系直接与我们联系。或者,也可以给编辑组发电子邮件,地址是implywallst.com。
本文由Simply Wall St.撰写,具有概括性。我们仅使用不偏不倚的方法提供基于历史数据和分析师预测的评论,我们的文章并不打算作为财务建议。它不构成买卖任何股票的建议,也没有考虑你的目标或你的财务状况。我们的目标是为您带来由基本面数据驱动的长期重点分析。请注意,我们的分析可能不会将最新的对价格敏感的公司公告或定性材料考虑在内。Simply Wall St.对上述任何一只股票都没有持仓。
moomoo是Moomoo Technologies Inc.公司提供的金融信息和交易应用程序。
在美国,moomoo上的投资产品和服务由Moomoo Financial Inc.提供,一家受美国证券交易委员会(SEC)监管的持牌主体。 Moomoo Financial Inc.是金融业监管局(FINRA)和证券投资者保护公司(SIPC)的成员。
在新加坡,moomoo上的投资产品和服务是通过Moomoo Financial Singapore Pte. Ltd.提供,该公司受新加坡金融管理局(MAS)监管(牌照号码︰CMS101000) ,持有资本市场服务牌照 (CMS) ,持有财务顾问豁免(Exempt Financial Adviser)资质。本内容未经新加坡金融管理局的审查。
在澳大利亚,moomoo上的金融产品和服务是通过Futu Securities (Australia) Ltd提供,该公司是受澳大利亚证券和投资委员会(ASIC)监管的澳大利亚金融服务许可机构(AFSL No. 224663)。请阅读并理解我们的《金融服务指南》、《条款与条件》、《隐私政策》和其他披露文件,这些文件可在我们的网站 https://www.moomoo.com/au中获取。
在加拿大,通过moomoo应用提供的仅限订单执行的券商服务由Moomoo Financial Canada Inc.提供,并受加拿大投资监管机构(CIRO)监管。
在马来西亚,moomoo上的投资产品和服务是通过Moomoo Securities Malaysia Sdn. Bhd. 提供,该公司受马来西亚证券监督委员会(SC)监管(牌照号码︰eCMSL/A0397/2024) ,持有资本市场服务牌照 (CMSL) 。本内容未经马来西亚证券监督委员会的审查。
Moomoo Technologies Inc., Moomoo Financial Inc., Moomoo Financial Singapore Pte. Ltd., Futu Securities (Australia) Ltd, Moomoo Financial Canada Inc.,和Moomoo Securities Malaysia Sdn. Bhd.是关联公司。
风险及免责提示
moomoo是Moomoo Technologies Inc.公司提供的金融信息和交易应用程序。
在美国,moomoo上的投资产品和服务由Moomoo Financial Inc.提供,一家受美国证券交易委员会(SEC)监管的持牌主体。 Moomoo Financial Inc.是金融业监管局(FINRA)和证券投资者保护公司(SIPC)的成员。
在新加坡,moomoo上的投资产品和服务是通过Moomoo Financial Singapore Pte. Ltd.提供,该公司受新加坡金融管理局(MAS)监管(牌照号码︰CMS101000) ,持有资本市场服务牌照 (CMS) ,持有财务顾问豁免(Exempt Financial Adviser)资质。本内容未经新加坡金融管理局的审查。
在澳大利亚,moomoo上的金融产品和服务是通过Futu Securities (Australia) Ltd提供,该公司是受澳大利亚证券和投资委员会(ASIC)监管的澳大利亚金融服务许可机构(AFSL No. 224663)。请阅读并理解我们的《金融服务指南》、《条款与条件》、《隐私政策》和其他披露文件,这些文件可在我们的网站 https://www.moomoo.com/au中获取。
在加拿大,通过moomoo应用提供的仅限订单执行的券商服务由Moomoo Financial Canada Inc.提供,并受加拿大投资监管机构(CIRO)监管。
在马来西亚,moomoo上的投资产品和服务是通过Moomoo Securities Malaysia Sdn. Bhd. 提供,该公司受马来西亚证券监督委员会(SC)监管(牌照号码︰eCMSL/A0397/2024) ,持有资本市场服务牌照 (CMSL) 。本内容未经马来西亚证券监督委员会的审查。
Moomoo Technologies Inc., Moomoo Financial Inc., Moomoo Financial Singapore Pte. Ltd., Futu Securities (Australia) Ltd, Moomoo Financial Canada Inc.,和Moomoo Securities Malaysia Sdn. Bhd.是关联公司。
- 分享到weixin
- 分享到qq
- 分享到facebook
- 分享到twitter
- 分享到微博
- 粘贴板
使用浏览器的分享功能,分享给你的好友吧