
-
市场
-
产品
-
资讯
-
Moo社区
-
课堂
-
查看更多
-
功能介绍
-
费用费用透明,无最低余额限制
投资选择、功能介绍、费用相关信息由Moomoo Financial Inc.提供
- English
- 中文繁體
- 中文简体
- 深色
- 浅色
Earnings Not Telling The Story For Suzhou Hesheng Special Material Co., Ltd. (SZSE:002290) After Shares Rise 39%
Earnings Not Telling The Story For Suzhou Hesheng Special Material Co., Ltd. (SZSE:002290) After Shares Rise 39%
Suzhou Hesheng Special Material Co., Ltd. (SZSE:002290) shares have continued their recent momentum with a 39% gain in the last month alone. The last 30 days bring the annual gain to a very sharp 35%.
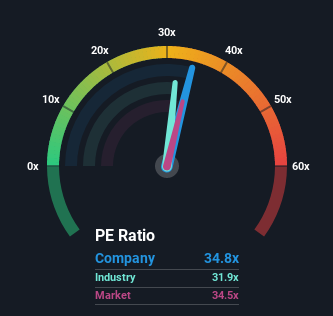
Although its price has surged higher, there still wouldn't be many who think Suzhou Hesheng Special Material's price-to-earnings (or "P/E") ratio of 34.8x is worth a mention when the median P/E in China is similar at about 35x. While this might not raise any eyebrows, if the P/E ratio is not justified investors could be missing out on a potential opportunity or ignoring looming disappointment.
For example, consider that Suzhou Hesheng Special Material's financial performance has been poor lately as it's earnings have been in decline. It might be that many expect the company to put the disappointing earnings performance behind them over the coming period, which has kept the P/E from falling. If you like the company, you'd at least be hoping this is the case so that you could potentially pick up some stock while it's not quite in favour.
Check out our latest analysis for Suzhou Hesheng Special Material
 SZSE:002290 Price Based on Past Earnings July 28th 2022 Want the full picture on earnings, revenue and cash flow for the company? Then our free report on Suzhou Hesheng Special Material will help you shine a light on its historical performance.
 What Are Growth Metrics Telling Us About The P/E?
The only time you'd be comfortable seeing a P/E like Suzhou Hesheng Special Material's is when the company's growth is tracking the market closely.
Retrospectively, the last year delivered a frustrating 13% decrease to the company's bottom line. However, a few very strong years before that means that it was still able to grow EPS by an impressive 44% in total over the last three years. Accordingly, while they would have preferred to keep the run going, shareholders would probably welcome the medium-term rates of earnings growth.
Weighing that recent medium-term earnings trajectory against the broader market's one-year forecast for expansion of 37% shows it's noticeably less attractive on an annualised basis.
In light of this, it's curious that Suzhou Hesheng Special Material's P/E sits in line with the majority of other companies. It seems most investors are ignoring the fairly limited recent growth rates and are willing to pay up for exposure to the stock. Maintaining these prices will be difficult to achieve as a continuation of recent earnings trends is likely to weigh down the shares eventually.
What We Can Learn From Suzhou Hesheng Special Material's P/E?
Its shares have lifted substantially and now Suzhou Hesheng Special Material's P/E is also back up to the market median. We'd say the price-to-earnings ratio's power isn't primarily as a valuation instrument but rather to gauge current investor sentiment and future expectations.
We've established that Suzhou Hesheng Special Material currently trades on a higher than expected P/E since its recent three-year growth is lower than the wider market forecast. Right now we are uncomfortable with the P/E as this earnings performance isn't likely to support a more positive sentiment for long. If recent medium-term earnings trends continue, it will place shareholders' investments at risk and potential investors in danger of paying an unnecessary premium.
You always need to take note of risks, for example - Suzhou Hesheng Special Material has 1 warning sign we think you should be aware of.
If these risks are making you reconsider your opinion on Suzhou Hesheng Special Material, explore our interactive list of high quality stocks to get an idea of what else is out there.
Have feedback on this article? Concerned about the content? Get in touch with us directly. Alternatively, email editorial-team (at) simplywallst.com.
This article by Simply Wall St is general in nature. We provide commentary based on historical data and analyst forecasts only using an unbiased methodology and our articles are not intended to be financial advice. It does not constitute a recommendation to buy or sell any stock, and does not take account of your objectives, or your financial situation. We aim to bring you long-term focused analysis driven by fundamental data. Note that our analysis may not factor in the latest price-sensitive company announcements or qualitative material. Simply Wall St has no position in any stocks mentioned.
苏州合盛特种材料有限公司。(SZSE:002290)仅在过去一个月,股价就延续了近期的势头,上涨了39%。在过去的30天里,年度涨幅达到了非常大的35%。
尽管苏州合生特材的价格飙升,但在中国市盈率中值约为35倍的情况下,仍不会有很多人认为苏州合生特材34.8倍的市盈率(P/E)值得一提。尽管这可能不会令人惊讶,但如果市盈率不合理,投资者可能会错过潜在的机会,或者忽视迫在眉睫的失望。
例如,考虑到苏州合生特材最近的财务表现不佳,因为它的收益一直在下降。许多人可能预计,该公司在未来一段时间内将把令人失望的收益表现抛在脑后,这让市盈率不会下降。如果你喜欢这家公司,你至少会希望情况是这样的,这样你就可以在它不太受欢迎的时候买入一些股票。
查看我们对苏州合生特殊材料的最新分析
SZSE:002290基于过去收益的价格2022年7月28日想要了解公司的收益、收入和现金流的全貌吗?那么我们的免费苏州合生特材报道,助您一窥合生的历史表现。增长指标告诉我们关于市盈率的哪些信息?
苏州合生特材这样的市盈率只有在该公司的增长密切跟踪市场的时候才会让你感到放心。
回顾过去一年,该公司的利润令人沮丧地下降了13%。然而,在此之前的几年非常强劲,这意味着它仍然能够在过去三年中实现令人印象深刻的44%的每股收益增长。因此,尽管股东们更愿意继续运营,但他们可能会欢迎中期的盈利增长率。
将最近的中期收益轨迹与大盘一年增长37%的预期进行比较,结果显示,按年率计算,它的吸引力明显下降。
有鉴于此,令人好奇的是,苏州合生特材的市盈率与大多数其他公司的市盈率是一致的。似乎大多数投资者都忽视了最近相当有限的增长率,并愿意为股票敞口支付高价。维持这些价格将很难实现,因为近期盈利趋势的延续最终可能会拖累该公司股价。
苏州合生特材市盈率对我们有何启示?
它的股价大幅上涨,现在苏州合生特材的市盈率也回到了市场中值。我们会说,市盈率的力量主要不是作为一种估值工具,而是衡量当前投资者的情绪和未来预期。
我们已经确定,苏州合生特殊材料目前的市盈率高于预期,因为其最近三年的增长低于更广泛的市场预测。目前,我们对市盈率感到不安,因为这种盈利表现不太可能在很长时间内支持更积极的情绪。如果近期的中期盈利趋势持续下去,将使股东的投资面临风险,潜在投资者面临支付不必要溢价的危险。
你总是需要注意风险,例如-苏州合生特材有1个警示标志我们认为你应该意识到。
如果这些风险让你重新考虑对苏州合生特材的看法,探索我们的高质量股票互动列表,以了解还有什么。
对这篇文章有什么反馈吗?担心内容吗? 保持联系直接与我们联系。或者,也可以给编辑组发电子邮件,地址是implywallst.com。
本文由Simply Wall St.撰写,具有概括性。我们仅使用不偏不倚的方法提供基于历史数据和分析师预测的评论,我们的文章并不打算作为财务建议。它不构成买卖任何股票的建议,也没有考虑你的目标或你的财务状况。我们的目标是为您带来由基本面数据驱动的长期重点分析。请注意,我们的分析可能不会将最新的对价格敏感的公司公告或定性材料考虑在内。Simply Wall St.对上述任何一只股票都没有持仓。
moomoo是Moomoo Technologies Inc.公司提供的金融信息和交易应用程序。
在美国,moomoo上的投资产品和服务由Moomoo Financial Inc.提供,一家受美国证券交易委员会(SEC)监管的持牌主体。 Moomoo Financial Inc.是金融业监管局(FINRA)和证券投资者保护公司(SIPC)的成员。
在新加坡,moomoo上的投资产品和服务是通过Moomoo Financial Singapore Pte. Ltd.提供,该公司受新加坡金融管理局(MAS)监管(牌照号码︰CMS101000) ,持有资本市场服务牌照 (CMS) ,持有财务顾问豁免(Exempt Financial Adviser)资质。本内容未经新加坡金融管理局的审查。
在澳大利亚,moomoo上的金融产品和服务是通过Futu Securities (Australia) Ltd提供,该公司是受澳大利亚证券和投资委员会(ASIC)监管的澳大利亚金融服务许可机构(AFSL No. 224663)。请阅读并理解我们的《金融服务指南》、《条款与条件》、《隐私政策》和其他披露文件,这些文件可在我们的网站 https://www.moomoo.com/au中获取。
在加拿大,通过moomoo应用提供的仅限订单执行的券商服务由Moomoo Financial Canada Inc.提供,并受加拿大投资监管机构(CIRO)监管。
在马来西亚,moomoo上的投资产品和服务是通过Moomoo Securities Malaysia Sdn. Bhd. 提供,该公司受马来西亚证券监督委员会(SC)监管(牌照号码︰eCMSL/A0397/2024) ,持有资本市场服务牌照 (CMSL) 。本内容未经马来西亚证券监督委员会的审查。
Moomoo Technologies Inc., Moomoo Financial Inc., Moomoo Financial Singapore Pte. Ltd., Futu Securities (Australia) Ltd, Moomoo Financial Canada Inc.,和Moomoo Securities Malaysia Sdn. Bhd.是关联公司。
风险及免责提示
moomoo是Moomoo Technologies Inc.公司提供的金融信息和交易应用程序。
在美国,moomoo上的投资产品和服务由Moomoo Financial Inc.提供,一家受美国证券交易委员会(SEC)监管的持牌主体。 Moomoo Financial Inc.是金融业监管局(FINRA)和证券投资者保护公司(SIPC)的成员。
在新加坡,moomoo上的投资产品和服务是通过Moomoo Financial Singapore Pte. Ltd.提供,该公司受新加坡金融管理局(MAS)监管(牌照号码︰CMS101000) ,持有资本市场服务牌照 (CMS) ,持有财务顾问豁免(Exempt Financial Adviser)资质。本内容未经新加坡金融管理局的审查。
在澳大利亚,moomoo上的金融产品和服务是通过Futu Securities (Australia) Ltd提供,该公司是受澳大利亚证券和投资委员会(ASIC)监管的澳大利亚金融服务许可机构(AFSL No. 224663)。请阅读并理解我们的《金融服务指南》、《条款与条件》、《隐私政策》和其他披露文件,这些文件可在我们的网站 https://www.moomoo.com/au中获取。
在加拿大,通过moomoo应用提供的仅限订单执行的券商服务由Moomoo Financial Canada Inc.提供,并受加拿大投资监管机构(CIRO)监管。
在马来西亚,moomoo上的投资产品和服务是通过Moomoo Securities Malaysia Sdn. Bhd. 提供,该公司受马来西亚证券监督委员会(SC)监管(牌照号码︰eCMSL/A0397/2024) ,持有资本市场服务牌照 (CMSL) 。本内容未经马来西亚证券监督委员会的审查。
Moomoo Technologies Inc., Moomoo Financial Inc., Moomoo Financial Singapore Pte. Ltd., Futu Securities (Australia) Ltd, Moomoo Financial Canada Inc.,和Moomoo Securities Malaysia Sdn. Bhd.是关联公司。
- 分享到weixin
- 分享到qq
- 分享到facebook
- 分享到twitter
- 分享到微博
- 粘贴板
使用浏览器的分享功能,分享给你的好友吧