
-
市场
-
产品
-
资讯
-
Moo社区
-
课堂
-
查看更多
-
功能介绍
-
费用费用透明,无最低余额限制
投资选择、功能介绍、费用相关信息由Moomoo Financial Inc.提供
- English
- 中文繁體
- 中文简体
- 深色
- 浅色
Shareholders in CK Hutchison Holdings (HKG:1) are in the red if they invested five years ago
Shareholders in CK Hutchison Holdings (HKG:1) are in the red if they invested five years ago
For many, the main point of investing is to generate higher returns than the overall market. But every investor is virtually certain to have both over-performing and under-performing stocks. So we wouldn't blame long term CK Hutchison Holdings Limited (HKG:1) shareholders for doubting their decision to hold, with the stock down 51% over a half decade.
So let's have a look and see if the longer term performance of the company has been in line with the underlying business' progress.
Check out our latest analysis for CK Hutchison Holdings
In his essay The Superinvestors of Graham-and-Doddsville Warren Buffett described how share prices do not always rationally reflect the value of a business. One flawed but reasonable way to assess how sentiment around a company has changed is to compare the earnings per share (EPS) with the share price.
While the share price declined over five years, CK Hutchison Holdings actually managed to increase EPS by an average of 0.4% per year. So it doesn't seem like EPS is a great guide to understanding how the market is valuing the stock. Alternatively, growth expectations may have been unreasonable in the past.
By glancing at these numbers, we'd posit that the the market had expectations of much higher growth, five years ago. Having said that, we might get a better idea of what's going on with the stock by looking at other metrics.
We note that the dividend has fallen in the last five years, so that may have contributed to the share price decline.
The graphic below depicts how earnings and revenue have changed over time (unveil the exact values by clicking on the image).
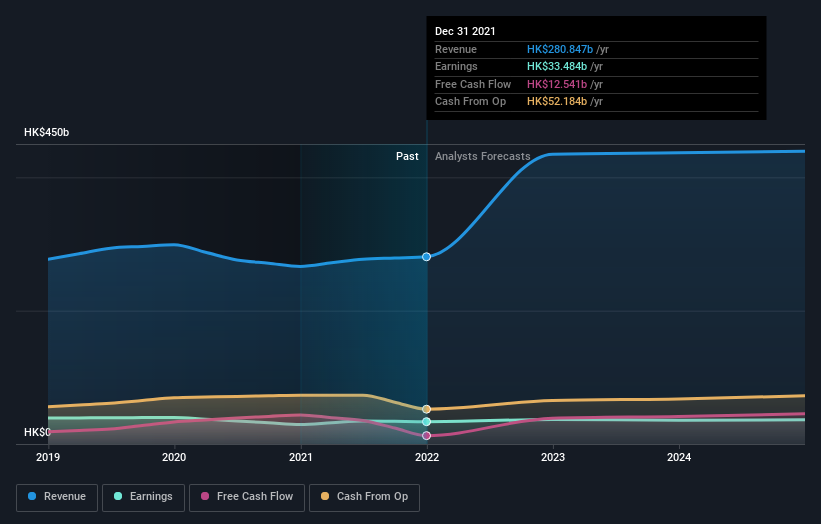 SEHK:1 Earnings and Revenue Growth July 28th 2022
We know that CK Hutchison Holdings has improved its bottom line lately, but what does the future have in store? So we recommend checking out this free report showing consensus forecasts
What About Dividends?
It is important to consider the total shareholder return, as well as the share price return, for any given stock. The TSR is a return calculation that accounts for the value of cash dividends (assuming that any dividend received was reinvested) and the calculated value of any discounted capital raisings and spin-offs. It's fair to say that the TSR gives a more complete picture for stocks that pay a dividend. We note that for CK Hutchison Holdings the TSR over the last 5 years was -40%, which is better than the share price return mentioned above. The dividends paid by the company have thusly boosted the total shareholder return.
A Different Perspective
While it's never nice to take a loss, CK Hutchison Holdings shareholders can take comfort that , including dividends,their trailing twelve month loss of 4.3% wasn't as bad as the market loss of around 13%. What is more upsetting is the 7% per annum loss investors have suffered over the last half decade. This sort of share price action isn't particularly encouraging, but at least the losses are slowing. It's always interesting to track share price performance over the longer term. But to understand CK Hutchison Holdings better, we need to consider many other factors. Case in point: We've spotted 2 warning signs for CK Hutchison Holdings you should be aware of.
We will like CK Hutchison Holdings better if we see some big insider buys. While we wait, check out this free list of growing companies with considerable, recent, insider buying.
Please note, the market returns quoted in this article reflect the market weighted average returns of stocks that currently trade on HK exchanges.
Have feedback on this article? Concerned about the content? Get in touch with us directly. Alternatively, email editorial-team (at) simplywallst.com.
This article by Simply Wall St is general in nature. We provide commentary based on historical data and analyst forecasts only using an unbiased methodology and our articles are not intended to be financial advice. It does not constitute a recommendation to buy or sell any stock, and does not take account of your objectives, or your financial situation. We aim to bring you long-term focused analysis driven by fundamental data. Note that our analysis may not factor in the latest price-sensitive company announcements or qualitative material. Simply Wall St has no position in any stocks mentioned.
对许多人来说,投资的主要目的是创造比整体市场更高的回报。但几乎可以肯定的是,每个投资者都会同时拥有表现优异和表现不佳的股票。所以我们不会责怪长期长和控股有限公司(香港:1)股东对他们持有股票的决定表示怀疑,该股在五年内下跌了51%。
因此,让我们来看看该公司的长期业绩是否与基础业务的进展一致。
查看我们对长和控股的最新分析
在他的文章中格雷厄姆和多德斯维尔的超级投资者沃伦·巴菲特描述了股价并不总是理性地反映一家企业的价值。评估围绕一家公司的情绪变化的一个有缺陷但合理的方法是将每股收益(EPS)与股价进行比较。
虽然股价在五年内下跌,但长和控股实际上成功地增加每股收益平均每年增长0.4%。因此,每股收益似乎并不能很好地指导人们理解市场对股票的估值。或者,增长预期在过去可能是不合理的。
通过浏览这些数字,我们可以假设,五年前,市场曾预期会有更高的增长。话虽如此,我们可能会通过查看其他指标来更好地了解股票的走势。
我们注意到,股息在过去五年里有所下降,这可能是导致股价下跌的原因之一。
下图描述了收益和收入随时间的变化(通过单击图像来揭示确切的价值)。
联交所:1盈利及收入增长2022年7月28日我们知道,长和控股最近提高了利润,但未来会发生什么?因此,我们建议您查看以下内容免费显示共识预测的报告
那股息呢?
重要的是要考虑任何给定股票的总股东回报以及股价回报。TSR是一种回报计算,计入了现金股息的价值(假设收到的任何股息都进行了再投资),以及任何贴现融资和剥离的计算价值。公平地说,TSR为支付股息的股票提供了更完整的图景。我们注意到,对于长和控股来说,过去5年的TSR为-40%,这比上面提到的股价回报要好。该公司支付的股息因此提振了总计股东回报。
不同的视角
虽然亏损从来都不是好事,但长和控股的股东们可以感到欣慰的是,包括股息在内,他们过去12个月的4.3%的亏损没有市场上约13%的亏损那么糟糕。更令人沮丧的是,投资者在过去五年里遭受了每年7%的损失。这种股价走势并不特别鼓舞人心,但至少损失正在放缓。跟踪股价的长期表现总是很有趣的。但要更好地理解长和控股,我们还需要考虑许多其他因素。一个恰当的例子:我们发现了长和控股的2个警告信号你应该意识到。
如果我们看到一些大的内部收购,我们会更喜欢长和控股。在我们等待的时候,看看这个免费最近有大量内幕收购的成长型公司名单。
请注意,本文引用的市场回报反映了目前在香港交易所交易的股票的市场加权平均回报。
对这篇文章有什么反馈吗?担心内容吗? 保持联系直接与我们联系。或者,也可以给编辑组发电子邮件,地址是implywallst.com。
本文由Simply Wall St.撰写,具有概括性。我们仅使用不偏不倚的方法提供基于历史数据和分析师预测的评论,我们的文章并不打算作为财务建议。它不构成买卖任何股票的建议,也没有考虑你的目标或你的财务状况。我们的目标是为您带来由基本面数据驱动的长期重点分析。请注意,我们的分析可能不会将最新的对价格敏感的公司公告或定性材料考虑在内。Simply Wall St.对上述任何一只股票都没有持仓。
moomoo是Moomoo Technologies Inc.公司提供的金融信息和交易应用程序。
在美国,moomoo上的投资产品和服务由Moomoo Financial Inc.提供,一家受美国证券交易委员会(SEC)监管的持牌主体。 Moomoo Financial Inc.是金融业监管局(FINRA)和证券投资者保护公司(SIPC)的成员。
在新加坡,moomoo上的投资产品和服务是通过Moomoo Financial Singapore Pte. Ltd.提供,该公司受新加坡金融管理局(MAS)监管(牌照号码︰CMS101000) ,持有资本市场服务牌照 (CMS) ,持有财务顾问豁免(Exempt Financial Adviser)资质。本内容未经新加坡金融管理局的审查。
在澳大利亚,moomoo上的金融产品和服务是通过Futu Securities (Australia) Ltd提供,该公司是受澳大利亚证券和投资委员会(ASIC)监管的澳大利亚金融服务许可机构(AFSL No. 224663)。请阅读并理解我们的《金融服务指南》、《条款与条件》、《隐私政策》和其他披露文件,这些文件可在我们的网站 https://www.moomoo.com/au中获取。
在加拿大,通过moomoo应用提供的仅限订单执行的券商服务由Moomoo Financial Canada Inc.提供,并受加拿大投资监管机构(CIRO)监管。
在马来西亚,moomoo上的投资产品和服务是通过Moomoo Securities Malaysia Sdn. Bhd. 提供,该公司受马来西亚证券监督委员会(SC)监管(牌照号码︰eCMSL/A0397/2024) ,持有资本市场服务牌照 (CMSL) 。本内容未经马来西亚证券监督委员会的审查。
Moomoo Technologies Inc., Moomoo Financial Inc., Moomoo Financial Singapore Pte. Ltd., Futu Securities (Australia) Ltd, Moomoo Financial Canada Inc.,和Moomoo Securities Malaysia Sdn. Bhd.是关联公司。
风险及免责提示
moomoo是Moomoo Technologies Inc.公司提供的金融信息和交易应用程序。
在美国,moomoo上的投资产品和服务由Moomoo Financial Inc.提供,一家受美国证券交易委员会(SEC)监管的持牌主体。 Moomoo Financial Inc.是金融业监管局(FINRA)和证券投资者保护公司(SIPC)的成员。
在新加坡,moomoo上的投资产品和服务是通过Moomoo Financial Singapore Pte. Ltd.提供,该公司受新加坡金融管理局(MAS)监管(牌照号码︰CMS101000) ,持有资本市场服务牌照 (CMS) ,持有财务顾问豁免(Exempt Financial Adviser)资质。本内容未经新加坡金融管理局的审查。
在澳大利亚,moomoo上的金融产品和服务是通过Futu Securities (Australia) Ltd提供,该公司是受澳大利亚证券和投资委员会(ASIC)监管的澳大利亚金融服务许可机构(AFSL No. 224663)。请阅读并理解我们的《金融服务指南》、《条款与条件》、《隐私政策》和其他披露文件,这些文件可在我们的网站 https://www.moomoo.com/au中获取。
在加拿大,通过moomoo应用提供的仅限订单执行的券商服务由Moomoo Financial Canada Inc.提供,并受加拿大投资监管机构(CIRO)监管。
在马来西亚,moomoo上的投资产品和服务是通过Moomoo Securities Malaysia Sdn. Bhd. 提供,该公司受马来西亚证券监督委员会(SC)监管(牌照号码︰eCMSL/A0397/2024) ,持有资本市场服务牌照 (CMSL) 。本内容未经马来西亚证券监督委员会的审查。
Moomoo Technologies Inc., Moomoo Financial Inc., Moomoo Financial Singapore Pte. Ltd., Futu Securities (Australia) Ltd, Moomoo Financial Canada Inc.,和Moomoo Securities Malaysia Sdn. Bhd.是关联公司。
- 分享到weixin
- 分享到qq
- 分享到facebook
- 分享到twitter
- 分享到微博
- 粘贴板
使用浏览器的分享功能,分享给你的好友吧