
-
市场
-
产品
-
资讯
-
Moo社区
-
课堂
-
查看更多
-
功能介绍
-
费用费用透明,无最低余额限制
投资选择、功能介绍、费用相关信息由Moomoo Financial Inc.提供
- English
- 中文繁體
- 中文简体
- 深色
- 浅色
HK Electric Investments and HK Electric Investments' (HKG:2638) investors will be pleased with their 1.2% return over the last three years
HK Electric Investments and HK Electric Investments' (HKG:2638) investors will be pleased with their 1.2% return over the last three years
No-one enjoys it when they lose money on a stock. But when the market is down, you're bound to have some losers. The HK Electric Investments and HK Electric Investments Limited (HKG:2638) is down 11% over three years, but the total shareholder return is 1.2% once you include the dividend. That's better than the market which declined 0.3% over the last three years.
Now let's have a look at the company's fundamentals, and see if the long term shareholder return has matched the performance of the underlying business.
See our latest analysis for HK Electric Investments and HK Electric Investments
There is no denying that markets are sometimes efficient, but prices do not always reflect underlying business performance. One way to examine how market sentiment has changed over time is to look at the interaction between a company's share price and its earnings per share (EPS).
HK Electric Investments and HK Electric Investments saw its EPS decline at a compound rate of 1.3% per year, over the last three years. The share price decline of 4% is actually steeper than the EPS slippage. So it seems the market was too confident about the business, in the past.
The graphic below depicts how EPS has changed over time (unveil the exact values by clicking on the image).
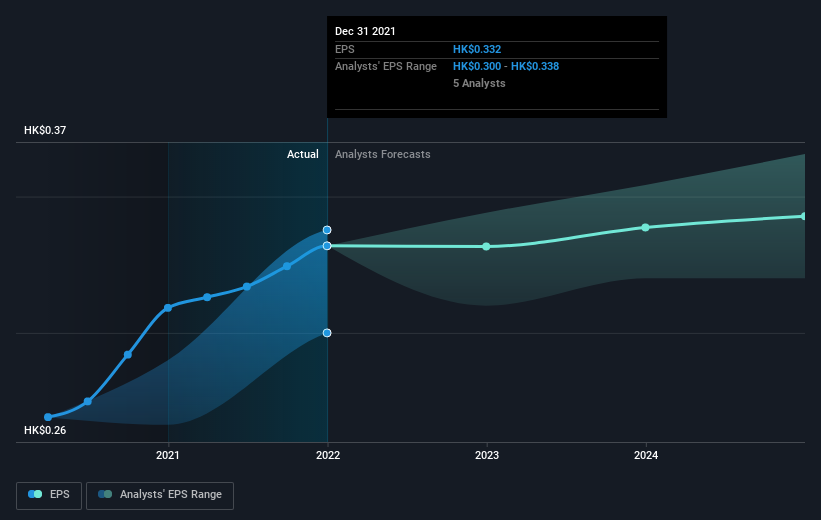 SEHK:2638 Earnings Per Share Growth July 12th 2022
Before buying or selling a stock, we always recommend a close examination of historic growth trends, available here.
What About Dividends?
It is important to consider the total shareholder return, as well as the share price return, for any given stock. Whereas the share price return only reflects the change in the share price, the TSR includes the value of dividends (assuming they were reinvested) and the benefit of any discounted capital raising or spin-off. It's fair to say that the TSR gives a more complete picture for stocks that pay a dividend. In the case of HK Electric Investments and HK Electric Investments, it has a TSR of 1.2% for the last 3 years. That exceeds its share price return that we previously mentioned. The dividends paid by the company have thusly boosted the total shareholder return.
A Different Perspective
Although it hurts that HK Electric Investments and HK Electric Investments returned a loss of 3.8% in the last twelve months, the broader market was actually worse, returning a loss of 18%. Of course, the long term returns are far more important and the good news is that over five years, the stock has returned 4% for each year. In the best case scenario the last year is just a temporary blip on the journey to a brighter future. It's always interesting to track share price performance over the longer term. But to understand HK Electric Investments and HK Electric Investments better, we need to consider many other factors. For instance, we've identified 2 warning signs for HK Electric Investments and HK Electric Investments that you should be aware of.
If you are like me, then you will not want to miss this free list of growing companies that insiders are buying.
Please note, the market returns quoted in this article reflect the market weighted average returns of stocks that currently trade on HK exchanges.
Have feedback on this article? Concerned about the content? Get in touch with us directly. Alternatively, email editorial-team (at) simplywallst.com.
This article by Simply Wall St is general in nature. We provide commentary based on historical data and analyst forecasts only using an unbiased methodology and our articles are not intended to be financial advice. It does not constitute a recommendation to buy or sell any stock, and does not take account of your objectives, or your financial situation. We aim to bring you long-term focused analysis driven by fundamental data. Note that our analysis may not factor in the latest price-sensitive company announcements or qualitative material. Simply Wall St has no position in any stocks mentioned.
当他们在一只股票上赔钱时,没有人喜欢它。但当市场下跌时,你肯定会有一些输家。这个港灯-SS有限公司(HKG:2638)过去三年下跌了11%,但如果计入股息,总股东回报率为1.2%。这比过去三年下跌0.3%的市场要好。
现在让我们来看看该公司的基本面,看看长期股东回报是否与基础业务的表现相匹配。
参见我们对港灯-SS的最新分析
不可否认,市场有时是有效的,但价格并不总是反映潜在的商业表现。考察市场情绪如何随时间变化的一种方法是观察一家公司的股价和每股收益(EPS)之间的相互作用。
过去三年,港灯-SS的每股收益以每年1.3%的复合速度下降。4%的股价跌幅实际上比每股收益下滑幅度更大。因此,过去市场似乎对这项业务过于自信。
下图描述了EPS是如何随着时间的推移而变化的(通过单击图像来揭示确切的值)。
联交所:2022年7月12日每股盈利增长2638在买卖股票之前,我们总是建议仔细研究一下历史增长趋势,可以在这里找到。
那股息呢?
重要的是要考虑任何给定股票的总股东回报以及股价回报。虽然股价回报只反映股价的变动,但TSR包括股息的价值(假设股息再投资),以及任何折价集资或分拆所带来的利益。公平地说,TSR为支付股息的股票提供了更完整的图景。以港灯-SS为例,它在过去3年的总资产收益率为1.2%。这超过了我们之前提到的它的股价回报。该公司支付的股息因此提振了总计股东回报。
不同的视角
尽管港灯-SS在过去12个月里损失了3.8%,令人痛心,但大盘实际上更糟糕,损失了18%。当然,长期回报要重要得多,好消息是,在过去的五年里,该股的年回报率为4%。在最好的情况下,去年只是通向更光明未来的旅途中的一个暂时的转折点。跟踪股价的长期表现总是很有趣的。但要更好地理解港灯-SS,我们还需要考虑许多其他因素。例如,我们已经确定港灯-SS的2个警示标志这一点你应该知道。
如果你像我一样,你会的不想怀念这一切吗?免费内部人士正在收购的成长型公司名单。
请注意,本文引用的市场回报反映了目前在香港交易所交易的股票的市场加权平均回报。
对这篇文章有什么反馈吗?担心内容吗? 保持联系直接与我们联系。或者,也可以给编辑组发电子邮件,地址是implywallst.com。
本文由Simply Wall St.撰写,具有概括性。我们仅使用不偏不倚的方法提供基于历史数据和分析师预测的评论,我们的文章并不打算作为财务建议。它不构成买卖任何股票的建议,也没有考虑你的目标或你的财务状况。我们的目标是为您带来由基本面数据驱动的长期重点分析。请注意,我们的分析可能不会将最新的对价格敏感的公司公告或定性材料考虑在内。Simply Wall St.对上述任何一只股票都没有持仓。
moomoo是Moomoo Technologies Inc.公司提供的金融信息和交易应用程序。
在美国,moomoo上的投资产品和服务由Moomoo Financial Inc.提供,一家受美国证券交易委员会(SEC)监管的持牌主体。 Moomoo Financial Inc.是金融业监管局(FINRA)和证券投资者保护公司(SIPC)的成员。
在新加坡,moomoo上的投资产品和服务是通过Moomoo Financial Singapore Pte. Ltd.提供,该公司受新加坡金融管理局(MAS)监管(牌照号码︰CMS101000) ,持有资本市场服务牌照 (CMS) ,持有财务顾问豁免(Exempt Financial Adviser)资质。本内容未经新加坡金融管理局的审查。
在澳大利亚,moomoo上的金融产品和服务是通过Futu Securities (Australia) Ltd提供,该公司是受澳大利亚证券和投资委员会(ASIC)监管的澳大利亚金融服务许可机构(AFSL No. 224663)。请阅读并理解我们的《金融服务指南》、《条款与条件》、《隐私政策》和其他披露文件,这些文件可在我们的网站 https://www.moomoo.com/au中获取。
在加拿大,通过moomoo应用提供的仅限订单执行的券商服务由Moomoo Financial Canada Inc.提供,并受加拿大投资监管机构(CIRO)监管。
在马来西亚,moomoo上的投资产品和服务是通过Moomoo Securities Malaysia Sdn. Bhd. 提供,该公司受马来西亚证券监督委员会(SC)监管(牌照号码︰eCMSL/A0397/2024) ,持有资本市场服务牌照 (CMSL) 。本内容未经马来西亚证券监督委员会的审查。
Moomoo Technologies Inc., Moomoo Financial Inc., Moomoo Financial Singapore Pte. Ltd., Futu Securities (Australia) Ltd, Moomoo Financial Canada Inc.,和Moomoo Securities Malaysia Sdn. Bhd.是关联公司。
风险及免责提示
moomoo是Moomoo Technologies Inc.公司提供的金融信息和交易应用程序。
在美国,moomoo上的投资产品和服务由Moomoo Financial Inc.提供,一家受美国证券交易委员会(SEC)监管的持牌主体。 Moomoo Financial Inc.是金融业监管局(FINRA)和证券投资者保护公司(SIPC)的成员。
在新加坡,moomoo上的投资产品和服务是通过Moomoo Financial Singapore Pte. Ltd.提供,该公司受新加坡金融管理局(MAS)监管(牌照号码︰CMS101000) ,持有资本市场服务牌照 (CMS) ,持有财务顾问豁免(Exempt Financial Adviser)资质。本内容未经新加坡金融管理局的审查。
在澳大利亚,moomoo上的金融产品和服务是通过Futu Securities (Australia) Ltd提供,该公司是受澳大利亚证券和投资委员会(ASIC)监管的澳大利亚金融服务许可机构(AFSL No. 224663)。请阅读并理解我们的《金融服务指南》、《条款与条件》、《隐私政策》和其他披露文件,这些文件可在我们的网站 https://www.moomoo.com/au中获取。
在加拿大,通过moomoo应用提供的仅限订单执行的券商服务由Moomoo Financial Canada Inc.提供,并受加拿大投资监管机构(CIRO)监管。
在马来西亚,moomoo上的投资产品和服务是通过Moomoo Securities Malaysia Sdn. Bhd. 提供,该公司受马来西亚证券监督委员会(SC)监管(牌照号码︰eCMSL/A0397/2024) ,持有资本市场服务牌照 (CMSL) 。本内容未经马来西亚证券监督委员会的审查。
Moomoo Technologies Inc., Moomoo Financial Inc., Moomoo Financial Singapore Pte. Ltd., Futu Securities (Australia) Ltd, Moomoo Financial Canada Inc.,和Moomoo Securities Malaysia Sdn. Bhd.是关联公司。
- 分享到weixin
- 分享到qq
- 分享到facebook
- 分享到twitter
- 分享到微博
- 粘贴板
使用浏览器的分享功能,分享给你的好友吧