
-
市场
-
产品
-
资讯
-
Moo社区
-
课堂
-
查看更多
-
功能介绍
-
费用费用透明,无最低余额限制
投资选择、功能介绍、费用相关信息由Moomoo Financial Inc.提供
- English
- 中文繁體
- 中文简体
- 深色
- 浅色
Calculating The Fair Value Of Huabao International Holdings Limited (HKG:336)
Calculating The Fair Value Of Huabao International Holdings Limited (HKG:336)
Today we will run through one way of estimating the intrinsic value of Huabao International Holdings Limited (HKG:336) by taking the forecast future cash flows of the company and discounting them back to today's value. The Discounted Cash Flow (DCF) model is the tool we will apply to do this. Don't get put off by the jargon, the math behind it is actually quite straightforward.
We would caution that there are many ways of valuing a company and, like the DCF, each technique has advantages and disadvantages in certain scenarios. If you want to learn more about discounted cash flow, the rationale behind this calculation can be read in detail in the Simply Wall St analysis model.
See our latest analysis for Huabao International Holdings
Is Huabao International Holdings fairly valued?
We're using the 2-stage growth model, which simply means we take in account two stages of company's growth. In the initial period the company may have a higher growth rate and the second stage is usually assumed to have a stable growth rate. To start off with, we need to estimate the next ten years of cash flows. Seeing as no analyst estimates of free cash flow are available to us, we have extrapolate the previous free cash flow (FCF) from the company's last reported value. We assume companies with shrinking free cash flow will slow their rate of shrinkage, and that companies with growing free cash flow will see their growth rate slow, over this period. We do this to reflect that growth tends to slow more in the early years than it does in later years.
Generally we assume that a dollar today is more valuable than a dollar in the future, and so the sum of these future cash flows is then discounted to today's value:
10-year free cash flow (FCF) estimate
| 2023 | 2024 | 2025 | 2026 | 2027 | 2028 | 2029 | 2030 | 2031 | 2032 | |
| Levered FCF (CN¥, Millions) | CN¥1.10b | CN¥1.09b | CN¥1.09b | CN¥1.09b | CN¥1.10b | CN¥1.11b | CN¥1.12b | CN¥1.14b | CN¥1.15b | CN¥1.17b |
| Growth Rate Estimate Source | Est @ -2.02% | Est @ -0.95% | Est @ -0.2% | Est @ 0.33% | Est @ 0.69% | Est @ 0.95% | Est @ 1.13% | Est @ 1.26% | Est @ 1.34% | Est @ 1.41% |
| Present Value (CN¥, Millions) Discounted @ 6.2% | CN¥1.0k | CN¥967 | CN¥909 | CN¥859 | CN¥815 | CN¥774 | CN¥738 | CN¥704 | CN¥672 | CN¥641 |
("Est" = FCF growth rate estimated by Simply Wall St)
Present Value of 10-year Cash Flow (PVCF) = CN¥8.1b
After calculating the present value of future cash flows in the initial 10-year period, we need to calculate the Terminal Value, which accounts for all future cash flows beyond the first stage. For a number of reasons a very conservative growth rate is used that cannot exceed that of a country's GDP growth. In this case we have used the 5-year average of the 10-year government bond yield (1.6%) to estimate future growth. In the same way as with the 10-year 'growth' period, we discount future cash flows to today's value, using a cost of equity of 6.2%.
Terminal Value (TV)= FCF2032 × (1 + g) ÷ (r – g) = CN¥1.2b× (1 + 1.6%) ÷ (6.2%– 1.6%) = CN¥26b
Present Value of Terminal Value (PVTV)= TV / (1 + r)10= CN¥26b÷ ( 1 + 6.2%)10= CN¥14b
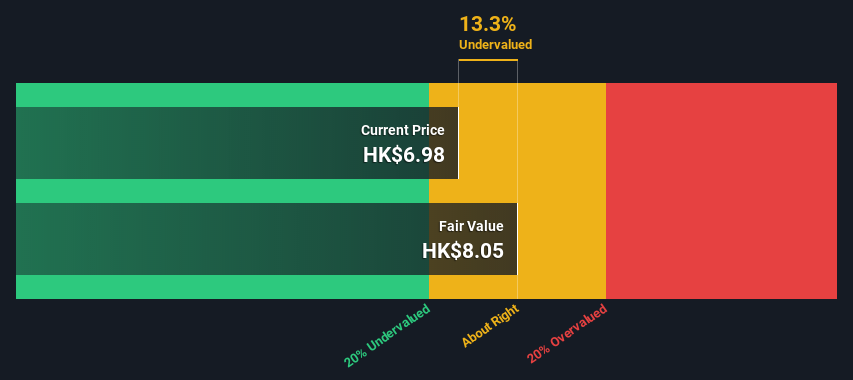
The total value is the sum of cash flows for the next ten years plus the discounted terminal value, which results in the Total Equity Value, which in this case is CN¥22b. In the final step we divide the equity value by the number of shares outstanding. Relative to the current share price of HK$7.0, the company appears about fair value at a 13% discount to where the stock price trades currently. Valuations are imprecise instruments though, rather like a telescope - move a few degrees and end up in a different galaxy. Do keep this in mind.
 SEHK:336 Discounted Cash Flow July 8th 2022
The assumptions
The calculation above is very dependent on two assumptions. The first is the discount rate and the other is the cash flows. If you don't agree with these result, have a go at the calculation yourself and play with the assumptions. The DCF also does not consider the possible cyclicality of an industry, or a company's future capital requirements, so it does not give a full picture of a company's potential performance. Given that we are looking at Huabao International Holdings as potential shareholders, the cost of equity is used as the discount rate, rather than the cost of capital (or weighted average cost of capital, WACC) which accounts for debt. In this calculation we've used 6.2%, which is based on a levered beta of 0.956. Beta is a measure of a stock's volatility, compared to the market as a whole. We get our beta from the industry average beta of globally comparable companies, with an imposed limit between 0.8 and 2.0, which is a reasonable range for a stable business.
Moving On:
Valuation is only one side of the coin in terms of building your investment thesis, and it ideally won't be the sole piece of analysis you scrutinize for a company. It's not possible to obtain a foolproof valuation with a DCF model. Instead the best use for a DCF model is to test certain assumptions and theories to see if they would lead to the company being undervalued or overvalued. For instance, if the terminal value growth rate is adjusted slightly, it can dramatically alter the overall result. For Huabao International Holdings, we've put together three additional factors you should further research:
- Risks: Case in point, we've spotted 3 warning signs for Huabao International Holdings you should be aware of, and 1 of them makes us a bit uncomfortable.
- Other Solid Businesses: Low debt, high returns on equity and good past performance are fundamental to a strong business. Why not explore our interactive list of stocks with solid business fundamentals to see if there are other companies you may not have considered!
- Other Environmentally-Friendly Companies: Concerned about the environment and think consumers will buy eco-friendly products more and more? Browse through our interactive list of companies that are thinking about a greener future to discover some stocks you may not have thought of!
PS. Simply Wall St updates its DCF calculation for every Hong Kong stock every day, so if you want to find the intrinsic value of any other stock just search here.
Have feedback on this article? Concerned about the content? Get in touch with us directly. Alternatively, email editorial-team (at) simplywallst.com.
This article by Simply Wall St is general in nature. We provide commentary based on historical data and analyst forecasts only using an unbiased methodology and our articles are not intended to be financial advice. It does not constitute a recommendation to buy or sell any stock, and does not take account of your objectives, or your financial situation. We aim to bring you long-term focused analysis driven by fundamental data. Note that our analysis may not factor in the latest price-sensitive company announcements or qualitative material. Simply Wall St has no position in any stocks mentioned.
今天,我们将通过一种方法来评估华宝国际控股有限公司(香港股票代码:336)的内在价值,方法是将公司未来的预测现金流折现为今天的价值。贴现现金流(DCF)模型是我们将应用的工具。不要被行话吓跑了,它背后的数学实际上是相当简单的。
我们要提醒的是,对一家公司进行估值的方法有很多种,与贴现现金流一样,每种方法在某些情况下都有优缺点。如果你想了解更多关于贴现现金流的信息,可以在Simply Wall St.分析模型中详细阅读这种计算背后的原理。
查看我们对华宝国际控股的最新分析
华宝国际控股的估值是否公允?
我们使用的是两阶段增长模型,也就是说,我们考虑了公司发展的两个阶段。在初期,公司可能有较高的增长率,而第二阶段通常被假设为有一个稳定的增长率。首先,我们需要估计未来十年的现金流。由于没有分析师对自由现金流的估计,我们根据公司最近报告的价值推断出了之前的自由现金流(FCF)。我们假设,自由现金流萎缩的公司将减缓收缩速度,而自由现金流增长的公司在这段时间内的增长速度将放缓。我们这样做是为了反映出,增长在最初几年往往比后来几年放缓得更多。
一般来说,我们假设今天的一美元比未来的一美元更有价值,所以这些未来现金流的总和就会贴现到今天的价值:
10年自由现金流(FCF)估计
| 2023 | 2024 | 2025 | 2026 | 2027 | 2028 | 2029 | 2030 | 2031 | 2032 | |
| 杠杆FCF(CN元,百万元) | CN元11.亿元 | 净额10.9亿元 | 净额10.9亿元 | 净额10.9亿元 | CN元11.亿元 | CN元11.1亿元 | CN元11.2亿元 | CN元11.4亿元 | CN元11.5亿元 | CN人民币11.7亿元 |
| 增长率预估来源 | Est@-2.02% | Est@-0.95% | Est@-0.2% | Est@0.33% | Est@0.69% | Est@0.95% | Est@1.13% | Est@1.26% | Est@1.34% | Est@1.41% |
| 现值(CN元,百万)贴现@6.2% | CN元10000元 | CN元967元 | CN元909元 | CN元859元 | CN元815元 | CN元774元 | CN元738元 | CN元704元 | CN元672元 | CN元641元 |
(“EST”=Simply Wall St.预估的FCF成长率)
10年期现金流现值(PVCF)=CN人民币81亿元
在计算了最初10年内未来现金流的现值后,我们需要计算终止值,它考虑了第一阶段之后的所有未来现金流。出于一些原因,使用了一个非常保守的增长率,不能超过一个国家的国内生产总值增长率。在这种情况下,我们使用了10年期政府债券收益率的5年平均值(1.6%)来估计未来的增长。与10年“增长”期一样,我们使用6.2%的权益成本将未来现金流贴现至当前价值。
终端值(TV)=FCF2032×(1+g)?(r-g)=CN元1.2b×(1+1.6%)?(6.2%-1.6%)=CN元26b
终值现值(PVTV)=TV/(1+r)10=260亿元?(1+6.2%)10=CN元140亿元
总价值是未来十年的现金流总和加上贴现的终端价值,得出总股权价值,在本例中为人民币220亿元。在最后一步,我们用股本价值除以流通股的数量。相对于目前7.0港元的股价,该公司的公允价值似乎比目前的股价有13%的折让。然而,估值是不精确的工具,更像是一台望远镜--移动几度,就会到达另一个星系。一定要记住这一点。
联交所:336贴现现金流2022年7月8日假设
上述计算在很大程度上取决于两个假设。第一个是贴现率,另一个是现金流。如果你不同意这些结果,你可以自己试一试计算,并玩弄一下假设。DCF也没有考虑一个行业可能的周期性,也没有考虑一家公司未来的资本要求,因此它没有给出一家公司潜在业绩的全貌。鉴于我们将华宝国际控股视为潜在股东,股权成本被用作贴现率,而不是占债务的资本成本(或加权平均资本成本,WACC)。在这次计算中,我们使用了6.2%,这是基于杠杆率为0.956的测试值。贝塔系数是衡量一只股票相对于整个市场的波动性的指标。我们的贝塔系数来自全球可比公司的行业平均贝塔系数,强制限制在0.8到2.0之间,这是一个稳定业务的合理范围。
下一步:
就构建你的投资论点而言,估值只是硬币的一面,理想情况下,它不会是你为一家公司仔细审查的唯一分析。用贴现现金流模型不可能获得万无一失的估值。相反,贴现现金流模型的最佳用途是测试某些假设和理论,看看它们是否会导致公司被低估或高估。例如,如果终端价值增长率稍有调整,可能会极大地改变整体结果。对于华宝国际控股,我们总结了三个你应该进一步研究的因素:
- 风险:例如,我们已经发现了华宝国际控股的3个警告信号你应该知道,其中的一个让我们有点不舒服。
- 其他稳固的企业:低债务、高股本回报率和良好的过去业绩是强劲业务的基础。为什么不探索我们具有坚实商业基本面的股票的互动列表,看看是否有其他您可能没有考虑过的公司!
- 其他环保公司:关注环境,认为消费者会越来越多地购买环保产品?浏览我们的互动列表,这些公司正在考虑更绿色的未来,发现一些你可能没有想到的股票!
PS.Simply Wall St.每天更新每只香港股票的贴现现金流计算,所以如果你想找出任何其他股票的内在价值,只需搜索此处。
对这篇文章有什么反馈吗?担心内容吗? 保持联系直接与我们联系。或者,也可以给编辑组发电子邮件,地址是implywallst.com。
本文由Simply Wall St.撰写,具有概括性。我们仅使用不偏不倚的方法提供基于历史数据和分析师预测的评论,我们的文章并不打算作为财务建议。它不构成买卖任何股票的建议,也没有考虑你的目标或你的财务状况。我们的目标是为您带来由基本面数据驱动的长期重点分析。请注意,我们的分析可能不会将最新的对价格敏感的公司公告或定性材料考虑在内。Simply Wall St.对上述任何一只股票都没有持仓。
moomoo是Moomoo Technologies Inc.公司提供的金融信息和交易应用程序。
在美国,moomoo上的投资产品和服务由Moomoo Financial Inc.提供,一家受美国证券交易委员会(SEC)监管的持牌主体。 Moomoo Financial Inc.是金融业监管局(FINRA)和证券投资者保护公司(SIPC)的成员。
在新加坡,moomoo上的投资产品和服务是通过Moomoo Financial Singapore Pte. Ltd.提供,该公司受新加坡金融管理局(MAS)监管(牌照号码︰CMS101000) ,持有资本市场服务牌照 (CMS) ,持有财务顾问豁免(Exempt Financial Adviser)资质。本内容未经新加坡金融管理局的审查。
在澳大利亚,moomoo上的金融产品和服务是通过Futu Securities (Australia) Ltd提供,该公司是受澳大利亚证券和投资委员会(ASIC)监管的澳大利亚金融服务许可机构(AFSL No. 224663)。请阅读并理解我们的《金融服务指南》、《条款与条件》、《隐私政策》和其他披露文件,这些文件可在我们的网站 https://www.moomoo.com/au中获取。
在加拿大,通过moomoo应用提供的仅限订单执行的券商服务由Moomoo Financial Canada Inc.提供,并受加拿大投资监管机构(CIRO)监管。
在马来西亚,moomoo上的投资产品和服务是通过Moomoo Securities Malaysia Sdn. Bhd. 提供,该公司受马来西亚证券监督委员会(SC)监管(牌照号码︰eCMSL/A0397/2024) ,持有资本市场服务牌照 (CMSL) 。本内容未经马来西亚证券监督委员会的审查。
Moomoo Technologies Inc., Moomoo Financial Inc., Moomoo Financial Singapore Pte. Ltd., Futu Securities (Australia) Ltd, Moomoo Financial Canada Inc.,和Moomoo Securities Malaysia Sdn. Bhd.是关联公司。
风险及免责提示
moomoo是Moomoo Technologies Inc.公司提供的金融信息和交易应用程序。
在美国,moomoo上的投资产品和服务由Moomoo Financial Inc.提供,一家受美国证券交易委员会(SEC)监管的持牌主体。 Moomoo Financial Inc.是金融业监管局(FINRA)和证券投资者保护公司(SIPC)的成员。
在新加坡,moomoo上的投资产品和服务是通过Moomoo Financial Singapore Pte. Ltd.提供,该公司受新加坡金融管理局(MAS)监管(牌照号码︰CMS101000) ,持有资本市场服务牌照 (CMS) ,持有财务顾问豁免(Exempt Financial Adviser)资质。本内容未经新加坡金融管理局的审查。
在澳大利亚,moomoo上的金融产品和服务是通过Futu Securities (Australia) Ltd提供,该公司是受澳大利亚证券和投资委员会(ASIC)监管的澳大利亚金融服务许可机构(AFSL No. 224663)。请阅读并理解我们的《金融服务指南》、《条款与条件》、《隐私政策》和其他披露文件,这些文件可在我们的网站 https://www.moomoo.com/au中获取。
在加拿大,通过moomoo应用提供的仅限订单执行的券商服务由Moomoo Financial Canada Inc.提供,并受加拿大投资监管机构(CIRO)监管。
在马来西亚,moomoo上的投资产品和服务是通过Moomoo Securities Malaysia Sdn. Bhd. 提供,该公司受马来西亚证券监督委员会(SC)监管(牌照号码︰eCMSL/A0397/2024) ,持有资本市场服务牌照 (CMSL) 。本内容未经马来西亚证券监督委员会的审查。
Moomoo Technologies Inc., Moomoo Financial Inc., Moomoo Financial Singapore Pte. Ltd., Futu Securities (Australia) Ltd, Moomoo Financial Canada Inc.,和Moomoo Securities Malaysia Sdn. Bhd.是关联公司。
- 分享到weixin
- 分享到qq
- 分享到facebook
- 分享到twitter
- 分享到微博
- 粘贴板
使用浏览器的分享功能,分享给你的好友吧