Is Sheng Siong Group Ltd's (SGX:OV8) Stock's Recent Performance A Reflection Of Its Financial Health?
Sheng Siong Group's (SGX:OV8) stock up by 4.4% over the past three months. Given its impressive performance, we decided to study the company's key financial indicators as a company's long-term fundamentals usually dictate market outcomes. Particularly, we will be paying attention to Sheng Siong Group's ROE today.
Return on equity or ROE is a key measure used to assess how efficiently a company's management is utilizing the company's capital. In short, ROE shows the profit each dollar generates with respect to its shareholder investments.
Check out our latest analysis for Sheng Siong Group
How Do You Calculate Return On Equity?
ROE can be calculated by using the formula:
Return on Equity = Net Profit (from continuing operations) ÷ Shareholders' Equity
So, based on the above formula, the ROE for Sheng Siong Group is:
31% = S$133m ÷ S$422m (Based on the trailing twelve months to September 2022).
The 'return' is the profit over the last twelve months. That means that for every SGD1 worth of shareholders' equity, the company generated SGD0.31 in profit.
What Has ROE Got To Do With Earnings Growth?
We have already established that ROE serves as an efficient profit-generating gauge for a company's future earnings. We now need to evaluate how much profit the company reinvests or "retains" for future growth which then gives us an idea about the growth potential of the company. Assuming all else is equal, companies that have both a higher return on equity and higher profit retention are usually the ones that have a higher growth rate when compared to companies that don't have the same features.
Sheng Siong Group's Earnings Growth And 31% ROE
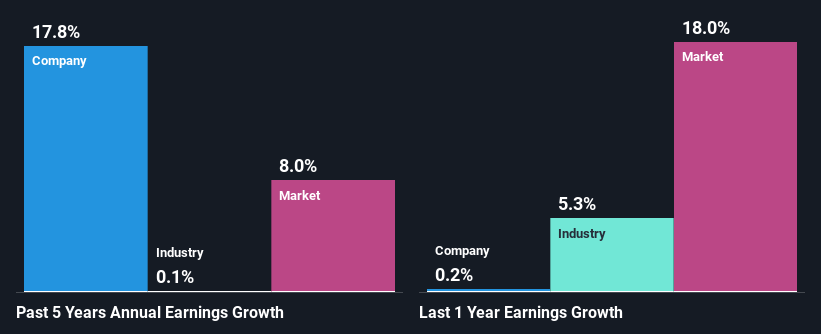
Firstly, we acknowledge that Sheng Siong Group has a significantly high ROE. Additionally, the company's ROE is higher compared to the industry average of 3.4% which is quite remarkable. This probably laid the groundwork for Sheng Siong Group's moderate 18% net income growth seen over the past five years.
Next, on comparing with the industry net income growth, we found that Sheng Siong Group's growth is quite high when compared to the industry average growth of 0.1% in the same period, which is great to see.
Earnings growth is an important metric to consider when valuing a stock. It’s important for an investor to know whether the market has priced in the company's expected earnings growth (or decline). This then helps them determine if the stock is placed for a bright or bleak future. What is OV8 worth today? The intrinsic value infographic in our free research report helps visualize whether OV8 is currently mispriced by the market.
Is Sheng Siong Group Making Efficient Use Of Its Profits?
The high three-year median payout ratio of 70% (or a retention ratio of 30%) for Sheng Siong Group suggests that the company's growth wasn't really hampered despite it returning most of its income to its shareholders.
Additionally, Sheng Siong Group has paid dividends over a period of at least ten years which means that the company is pretty serious about sharing its profits with shareholders. Our latest analyst data shows that the future payout ratio of the company over the next three years is expected to be approximately 70%. As a result, Sheng Siong Group's ROE is not expected to change by much either, which we inferred from the analyst estimate of 28% for future ROE.
Conclusion
On the whole, we feel that Sheng Siong Group's performance has been quite good. In particular, its high ROE is quite noteworthy and also the probable explanation behind its considerable earnings growth. Yet, the company is retaining a small portion of its profits. Which means that the company has been able to grow its earnings in spite of it, so that's not too bad. Having said that, the company's earnings growth is expected to slow down, as forecasted in the current analyst estimates. To know more about the company's future earnings growth forecasts take a look at this free report on analyst forecasts for the company to find out more.
Have feedback on this article? Concerned about the content? Get in touch with us directly. Alternatively, email editorial-team (at) simplywallst.com.
This article by Simply Wall St is general in nature. We provide commentary based on historical data and analyst forecasts only using an unbiased methodology and our articles are not intended to be financial advice. It does not constitute a recommendation to buy or sell any stock, and does not take account of your objectives, or your financial situation. We aim to bring you long-term focused analysis driven by fundamental data. Note that our analysis may not factor in the latest price-sensitive company announcements or qualitative material. Simply Wall St has no position in any stocks mentioned.
Join A Paid User Research Session
You’ll receive a US$30 Amazon Gift card for 1 hour of your time while helping us build better investing tools for the individual investors like yourself. Sign up here
