Calculating The Fair Value Of Baker Technology Limited (SGX:BTP)
Today we will run through one way of estimating the intrinsic value of Baker Technology Limited (SGX:BTP) by estimating the company's future cash flows and discounting them to their present value. The Discounted Cash Flow (DCF) model is the tool we will apply to do this. Believe it or not, it's not too difficult to follow, as you'll see from our example!
We would caution that there are many ways of valuing a company and, like the DCF, each technique has advantages and disadvantages in certain scenarios. If you want to learn more about discounted cash flow, the rationale behind this calculation can be read in detail in the Simply Wall St analysis model.
View our latest analysis for Baker Technology
Step By Step Through The Calculation
We're using the 2-stage growth model, which simply means we take in account two stages of company's growth. In the initial period the company may have a higher growth rate and the second stage is usually assumed to have a stable growth rate. To begin with, we have to get estimates of the next ten years of cash flows. Seeing as no analyst estimates of free cash flow are available to us, we have extrapolate the previous free cash flow (FCF) from the company's last reported value. We assume companies with shrinking free cash flow will slow their rate of shrinkage, and that companies with growing free cash flow will see their growth rate slow, over this period. We do this to reflect that growth tends to slow more in the early years than it does in later years.
A DCF is all about the idea that a dollar in the future is less valuable than a dollar today, so we discount the value of these future cash flows to their estimated value in today's dollars:
10-year free cash flow (FCF) forecast
2023 | 2024 | 2025 | 2026 | 2027 | 2028 | 2029 | 2030 | 2031 | 2032 | |
Levered FCF (SGD, Millions) | S$12.5m | S$13.5m | S$14.3m | S$15.0m | S$15.6m | S$16.1m | S$16.6m | S$17.0m | S$17.4m | S$17.8m |
Growth Rate Estimate Source | Est @ 10.67% | Est @ 8.03% | Est @ 6.18% | Est @ 4.88% | Est @ 3.98% | Est @ 3.34% | Est @ 2.90% | Est @ 2.59% | Est @ 2.37% | Est @ 2.22% |
Present Value (SGD, Millions) Discounted @ 11% | S$11.2 | S$11.0 | S$10.5 | S$9.9 | S$9.3 | S$8.7 | S$8.1 | S$7.5 | S$6.9 | S$6.4 |
("Est" = FCF growth rate estimated by Simply Wall St)
Present Value of 10-year Cash Flow (PVCF) = S$89m
We now need to calculate the Terminal Value, which accounts for all the future cash flows after this ten year period. The Gordon Growth formula is used to calculate Terminal Value at a future annual growth rate equal to the 5-year average of the 10-year government bond yield of 1.9%. We discount the terminal cash flows to today's value at a cost of equity of 11%.
Terminal Value (TV)= FCF2032 × (1 + g) ÷ (r – g) = S$18m× (1 + 1.9%) ÷ (11%– 1.9%) = S$202m
Present Value of Terminal Value (PVTV)= TV / (1 + r)10= S$202m÷ ( 1 + 11%)10= S$72m
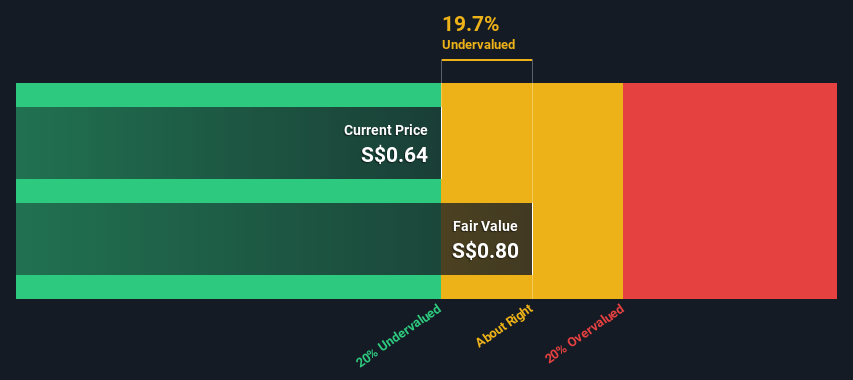
The total value, or equity value, is then the sum of the present value of the future cash flows, which in this case is S$162m. In the final step we divide the equity value by the number of shares outstanding. Relative to the current share price of S$0.6, the company appears about fair value at a 20% discount to where the stock price trades currently. Valuations are imprecise instruments though, rather like a telescope - move a few degrees and end up in a different galaxy. Do keep this in mind.
Important Assumptions
We would point out that the most important inputs to a discounted cash flow are the discount rate and of course the actual cash flows. Part of investing is coming up with your own evaluation of a company's future performance, so try the calculation yourself and check your own assumptions. The DCF also does not consider the possible cyclicality of an industry, or a company's future capital requirements, so it does not give a full picture of a company's potential performance. Given that we are looking at Baker Technology as potential shareholders, the cost of equity is used as the discount rate, rather than the cost of capital (or weighted average cost of capital, WACC) which accounts for debt. In this calculation we've used 11%, which is based on a levered beta of 1.492. Beta is a measure of a stock's volatility, compared to the market as a whole. We get our beta from the industry average beta of globally comparable companies, with an imposed limit between 0.8 and 2.0, which is a reasonable range for a stable business.
SWOT Analysis for Baker Technology
Strength
Debt is not viewed as a risk.
Weakness
Dividend is low compared to the top 25% of dividend payers in the Energy Services market.
Opportunity
Current share price is below our estimate of fair value.
Significant insider buying over the past 3 months.
Lack of analyst coverage makes it difficult to determine BTP's earnings prospects.
Threat
No apparent threats visible for BTP.
Next Steps:
Although the valuation of a company is important, it is only one of many factors that you need to assess for a company. It's not possible to obtain a foolproof valuation with a DCF model. Instead the best use for a DCF model is to test certain assumptions and theories to see if they would lead to the company being undervalued or overvalued. For example, changes in the company's cost of equity or the risk free rate can significantly impact the valuation. For Baker Technology, we've compiled three further factors you should further research:
Risks: For instance, we've identified 2 warning signs for Baker Technology that you should be aware of.
Management:Have insiders been ramping up their shares to take advantage of the market's sentiment for BTP's future outlook? Check out our management and board analysis with insights on CEO compensation and governance factors.
Other High Quality Alternatives: Do you like a good all-rounder? Explore our interactive list of high quality stocks to get an idea of what else is out there you may be missing!
PS. The Simply Wall St app conducts a discounted cash flow valuation for every stock on the SGX every day. If you want to find the calculation for other stocks just search here.
Have feedback on this article? Concerned about the content? Get in touch with us directly. Alternatively, email editorial-team (at) simplywallst.com.
This article by Simply Wall St is general in nature. We provide commentary based on historical data and analyst forecasts only using an unbiased methodology and our articles are not intended to be financial advice. It does not constitute a recommendation to buy or sell any stock, and does not take account of your objectives, or your financial situation. We aim to bring you long-term focused analysis driven by fundamental data. Note that our analysis may not factor in the latest price-sensitive company announcements or qualitative material. Simply Wall St has no position in any stocks mentioned.
Join A Paid User Research Session
You’ll receive a US$30 Amazon Gift card for 1 hour of your time while helping us build better investing tools for the individual investors like yourself. Sign up here
