



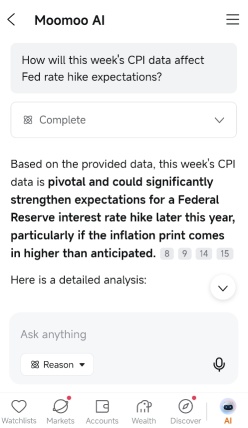
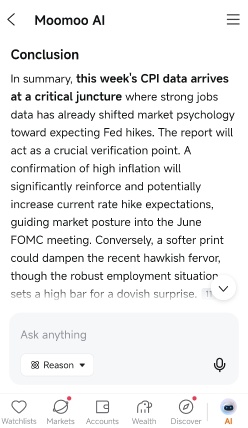
Using Moomoo AI honestly felt like having a knowledgeable friend next to me. This week’s CPI data was confusing at first, but the tool gave me a clear visual of how it could push the Fed to hike rates. What really helped was how it highlighted the key risks—like inflation coming in higher than expected. That gave me real confidence in what might happen next in the market. For such a complex macro topic, it’s surprisingly easy to use.
Current Index Situation:
– S&P 500 ( $S&P 500 Index (.SPX.US)$ ): +1.02% 📊 (Back above 6886, "Iran who?")
– Dow ( $Dow Jones Industrial Average (.DJI.US)$ ): +0.63% 🏗️ (48,218—still chasing 50K like a degen)
– NASDAQ ( $Invesco QQQ Trust (QQQ.US)$ ): +1.23% 💻 (Nine-day win streak 🤯, AI hype train unstoppable)
Market Analysis:
– Peace in the Middle East? 🕊️ Iran-US deal hopes sent stocks "from red to green faster than a Tesla Model S" 🚗⚡. S&P erased all post-conflict losses—bulls bac...
– S&P 500 ( $S&P 500 Index (.SPX.US)$ ): +1.02% 📊 (Back above 6886, "Iran who?")
– Dow ( $Dow Jones Industrial Average (.DJI.US)$ ): +0.63% 🏗️ (48,218—still chasing 50K like a degen)
– NASDAQ ( $Invesco QQQ Trust (QQQ.US)$ ): +1.23% 💻 (Nine-day win streak 🤯, AI hype train unstoppable)
Market Analysis:
– Peace in the Middle East? 🕊️ Iran-US deal hopes sent stocks "from red to green faster than a Tesla Model S" 🚗⚡. S&P erased all post-conflict losses—bulls bac...
1
This chart leaves no room for doubt.
$S&P 500 Index (.SPX.US)$ : Every bull/bear cycle since 1949
Bull markets:
→ Avg. duration: 5.3 years
→ Avg. gain: +254%
→ Longest: 12.3 years (+841%)
Bear markets:
→ Avg. duration: 1.0 year
→ Avg. loss: −31%
→ Worst: 1.4 years (−55%)
The asymmetry is staggering.
You spend years grinding gains stair-by-stair…
Then the elevator drops, erasing months of progress.
But here’s the truth this chart reveals:
The blue lin...
$S&P 500 Index (.SPX.US)$ : Every bull/bear cycle since 1949
Bull markets:
→ Avg. duration: 5.3 years
→ Avg. gain: +254%
→ Longest: 12.3 years (+841%)
Bear markets:
→ Avg. duration: 1.0 year
→ Avg. loss: −31%
→ Worst: 1.4 years (−55%)
The asymmetry is staggering.
You spend years grinding gains stair-by-stair…
Then the elevator drops, erasing months of progress.
But here’s the truth this chart reveals:
The blue lin...

1
$NASDAQ 100 Index (.NDX.US)$ been stuck below its ATH for 100 days now—longest stretch since 2023. But check this: it’s only -10% off the peak, the 6th time this script played out since 1985.
History says 📜:
– 1 month later: 80% chance Nasdaq is flat/up, avg +1.1%
– 2 months later: 80% positive, avg +2.3%
– 12 months later: 100% higher, avg +17.0%
Tech stocks bouta moon? Or is this the calm before the storm?
Now, $S&P 500 Index (.SPX.US)$ flashback 🎬:
Every crash since 2020 foll...
History says 📜:
– 1 month later: 80% chance Nasdaq is flat/up, avg +1.1%
– 2 months later: 80% positive, avg +2.3%
– 12 months later: 100% higher, avg +17.0%
Tech stocks bouta moon? Or is this the calm before the storm?
Now, $S&P 500 Index (.SPX.US)$ flashback 🎬:
Every crash since 2020 foll...

SPX Action:
$S&P 500 Index (.SPX.US)$ been acting weird lately – every Thursday for months straight, it’s been a red day. If this trend keeps up, we might see a drop to 6500-6520 by Friday (current support zone). To flip bullish this week, SPX needs to reclaim 6700 ASAP. But tread carefully – every rally the past 2 months got sold off hard. 🚨
Fed Drama Alert:
Yesterday’s FOMC meeting was a doozy:
– No rate cuts (again) – second meeting in a row. 🛑
– They’re now projecting 1 cut...
$S&P 500 Index (.SPX.US)$ been acting weird lately – every Thursday for months straight, it’s been a red day. If this trend keeps up, we might see a drop to 6500-6520 by Friday (current support zone). To flip bullish this week, SPX needs to reclaim 6700 ASAP. But tread carefully – every rally the past 2 months got sold off hard. 🚨
Fed Drama Alert:
Yesterday’s FOMC meeting was a doozy:
– No rate cuts (again) – second meeting in a row. 🛑
– They’re now projecting 1 cut...
2
1
มาตัดเสียงรบกวนทิ้ง แล้วโฟกัสที่รายงาน CPI ในวันพรุ่งนี้ดีกว่า ว่าตัวเลขที่ออกมาจะส่งผลยังไงต่อ...สายลับ/QQQ ไม่มีน้ำ มีแต่เนื้อล้วนๆ จากประสบการณ์จริงของคนที่เคยเจ็บหนักกับค่าขนส่งและค่าธรรมเนียมจุกจิกของ SYSCO มาแล้ว 🍅💸
ตัวเลข CPI ที่ต้องจับตามอง
– ดัชนีราคาผู้บริโภค (MoM): คาดการณ์0.3%(YoY:2.4%)
– ดัชนีราคาผู้บริโภคพื้นฐาน (Core CPI MoM): คาดการณ์0.2%(YoY:2.5%) – ตัวนี้จะตัดค่าอาหารและพลังงานออกไป ดังนั้นการพุ่งขึ้นของราคาน้ำมันจะไม่ทำให้ตัวเลขนี้เพี้ยน.
ทำไมน้ำมันถึงยังสำคัญ (แม้ว่า Core CPI จะไม่ได้รวมไว้ก็ตาม)
ราคาน้ำมันดีดตัวขึ้น20%+ในเดือนนี้ และถึงแม้ว่ามันจะยังไม่ส่งผลกระทบต่อผู้บริโภคแบบเต็มๆ...
ตัวเลข CPI ที่ต้องจับตามอง
– ดัชนีราคาผู้บริโภค (MoM): คาดการณ์0.3%(YoY:2.4%)
– ดัชนีราคาผู้บริโภคพื้นฐาน (Core CPI MoM): คาดการณ์0.2%(YoY:2.5%) – ตัวนี้จะตัดค่าอาหารและพลังงานออกไป ดังนั้นการพุ่งขึ้นของราคาน้ำมันจะไม่ทำให้ตัวเลขนี้เพี้ยน.
ทำไมน้ำมันถึงยังสำคัญ (แม้ว่า Core CPI จะไม่ได้รวมไว้ก็ตาม)
ราคาน้ำมันดีดตัวขึ้น20%+ในเดือนนี้ และถึงแม้ว่ามันจะยังไม่ส่งผลกระทบต่อผู้บริโภคแบบเต็มๆ...
👋 มาสรุปสถานการณ์ตลาดวันนี้กันหน่อย หลังจากมีดราม่าเรื่องการแถลงนโยบายประจำปี (SOTU) เมื่อคืนนี้ 🎭
คืออย่างนี้ ทำเนียบขาวเพิ่งทิ้งระเบิดลูกใหญ่ 💣 โดยการทำข้อตกลง "Taxpayer Protection Pledge" กับยักษ์ใหญ่หลายเจ้าอย่าง $Microsoft (MSFT.US)$ , $Alphabet-C (GOOG.US)$ , $Amazon (AMZN.US)$ , $Meta Platforms (META.US)$ และ OpenAI เรื่องมีอยู่ว่า ☕ บรรดาเจ้าพ่อดาต้าเซ็นเตอร์ AI พวกนี้กำลังสูบไฟฟ้าจากโครงข่ายแบบไม่ลืมหูลืมตา จนทำให้ค่าไฟตามบ้านพุ่งกระฉูด 📈 ตอนนี้รัฐบาลเลยเริ่มที่จะ...
คืออย่างนี้ ทำเนียบขาวเพิ่งทิ้งระเบิดลูกใหญ่ 💣 โดยการทำข้อตกลง "Taxpayer Protection Pledge" กับยักษ์ใหญ่หลายเจ้าอย่าง $Microsoft (MSFT.US)$ , $Alphabet-C (GOOG.US)$ , $Amazon (AMZN.US)$ , $Meta Platforms (META.US)$ และ OpenAI เรื่องมีอยู่ว่า ☕ บรรดาเจ้าพ่อดาต้าเซ็นเตอร์ AI พวกนี้กำลังสูบไฟฟ้าจากโครงข่ายแบบไม่ลืมหูลืมตา จนทำให้ค่าไฟตามบ้านพุ่งกระฉูด 📈 ตอนนี้รัฐบาลเลยเริ่มที่จะ...
4
2
2
📉 S&P 500 ( $S&P 500 Index (.SPX.US)$ ) ตึงจัด เริ่มไปต่อไม่ไหว
ตั้งแต่ 29 ต.ค.: รวมแล้ว +0.2% (แทบจะนิ่งสนิท) ทั้งที่มีแต่คนพูดเรื่อง "ตลาดกระทิงตลอดกาล"
การดีดตัวระยะสั้นโดนเทขายตลอด: ทุกครั้งที่เด้งขึ้นมานิดเดียวก็โดนทุบกลับลงไป โมเมนตัมกำลังแผ่วลงอย่างเร็ว
$CBOE Volatility S&P 500 Index (.VIX.US)$ (ดัชนีวัดความกลัว): ทำจุดต่ำสุดใหม่ที่สูงขึ้น (higher lows) แปลว่าความชะล่าใจเริ่มหายไปแล้ว
– กลยุทธ์: อาจจะมีจังหวะบีบตัวขึ้นไปสั้นๆ แต่ "เหวอยู่ไม่ไกล" นักเทรด ที่ผมตามอยู่เริ่มเก็บ Puts ของวันที่ 20 มี.ค. ตั้งแต่วันที่ 18 ก.พ. แล้ว
💡 สัญญาณเตือนจุดสูงสุดของตลาดกำลังกะพริบ
– AAII Sen...
ตั้งแต่ 29 ต.ค.: รวมแล้ว +0.2% (แทบจะนิ่งสนิท) ทั้งที่มีแต่คนพูดเรื่อง "ตลาดกระทิงตลอดกาล"
การดีดตัวระยะสั้นโดนเทขายตลอด: ทุกครั้งที่เด้งขึ้นมานิดเดียวก็โดนทุบกลับลงไป โมเมนตัมกำลังแผ่วลงอย่างเร็ว
$CBOE Volatility S&P 500 Index (.VIX.US)$ (ดัชนีวัดความกลัว): ทำจุดต่ำสุดใหม่ที่สูงขึ้น (higher lows) แปลว่าความชะล่าใจเริ่มหายไปแล้ว
– กลยุทธ์: อาจจะมีจังหวะบีบตัวขึ้นไปสั้นๆ แต่ "เหวอยู่ไม่ไกล" นักเทรด ที่ผมตามอยู่เริ่มเก็บ Puts ของวันที่ 20 มี.ค. ตั้งแต่วันที่ 18 ก.พ. แล้ว
💡 สัญญาณเตือนจุดสูงสุดของตลาดกำลังกะพริบ
– AAII Sen...

2
1. S&P 500 และความผันผวนจากนโยบาย Fed $S&P 500 Index (.SPX.US)$
– บริบททางประวัติศาสตร์: ตั้งแต่ปี 1930 การเข้ารับตำแหน่งของประธาน Fed คนใหม่ มักจะทำให้ดัชนี S&P 500 ย่อตัวลงเฉลี่ยที่ 5% (ใน 1 เดือน), 12% (ใน 3 เดือน) และ 16% (ใน 6 เดือน) หลังการเสนอชื่อ ซึ่งโทนการดำเนินนโยบายเชิงรุก (Hawkish) ของ Kevin Warsh ได้ทำให้ตลาดขวัญผวาไปแล้ว และนี่เป็นเพียงจุดเริ่มต้นของสถานการณ์นี้เท่านั้น
– ความเสี่ยงจากการเลือกตั้งกลางเทอม: ถ้า Warsh เข้ารับตำแหน่งในเดือนพฤษภาคม แล้ว S&P 500 ย่อตัวลง 16% ภายในช่วงเลือกตั้งกลางเทอมเดือนพฤศจิกายน การหาเสียงเลือกตั้งใหม่ของ Trump อาจจะ...
– บริบททางประวัติศาสตร์: ตั้งแต่ปี 1930 การเข้ารับตำแหน่งของประธาน Fed คนใหม่ มักจะทำให้ดัชนี S&P 500 ย่อตัวลงเฉลี่ยที่ 5% (ใน 1 เดือน), 12% (ใน 3 เดือน) และ 16% (ใน 6 เดือน) หลังการเสนอชื่อ ซึ่งโทนการดำเนินนโยบายเชิงรุก (Hawkish) ของ Kevin Warsh ได้ทำให้ตลาดขวัญผวาไปแล้ว และนี่เป็นเพียงจุดเริ่มต้นของสถานการณ์นี้เท่านั้น
– ความเสี่ยงจากการเลือกตั้งกลางเทอม: ถ้า Warsh เข้ารับตำแหน่งในเดือนพฤษภาคม แล้ว S&P 500 ย่อตัวลง 16% ภายในช่วงเลือกตั้งกลางเทอมเดือนพฤศจิกายน การหาเสียงเลือกตั้งใหม่ของ Trump อาจจะ...
22
2
การเคลื่อนไหวของดัชนีสำคัญ
$S&P 500 Index (.SPX.US)$ S&P 500: -0.13% อยู่ที่ 6,969.01 (ผันผวน ยังไม่มีทิศทางชัดเจน)
$Dow Jones Industrial Average (.DJI.US)$ Dow: +0.11% อยู่ที่ 49,071.56 (หุ้นกลุ่ม Defensive ช่วยพยุงหลังกลุ่ม Tech ร่วง)
$Nasdaq Composite Index (.IXIC.US)$ Nasdaq: -0.72% อยู่ที่ 23,685.12 (ผู้นำกลุ่ม AI ฉุดตลาด ทำ QQQ เผชิญแรงกดดัน)
ภาคธุรกิจ Tech เลือดอาบ
$Microsoft (MSFT.US)$ : -10% (วันที่แย่ที่สุดตั้งแต่ปี 2020 มูลค่าหายไปกว่า 2.81 แสนล้านดอลลาร์ — มากที่สุดเป็นอันดับ 2 ในประวัติศาสตร์สหรัฐฯ)
$Meta Platforms (META.US)$ ...
$S&P 500 Index (.SPX.US)$ S&P 500: -0.13% อยู่ที่ 6,969.01 (ผันผวน ยังไม่มีทิศทางชัดเจน)
$Dow Jones Industrial Average (.DJI.US)$ Dow: +0.11% อยู่ที่ 49,071.56 (หุ้นกลุ่ม Defensive ช่วยพยุงหลังกลุ่ม Tech ร่วง)
$Nasdaq Composite Index (.IXIC.US)$ Nasdaq: -0.72% อยู่ที่ 23,685.12 (ผู้นำกลุ่ม AI ฉุดตลาด ทำ QQQ เผชิญแรงกดดัน)
ภาคธุรกิจ Tech เลือดอาบ
$Microsoft (MSFT.US)$ : -10% (วันที่แย่ที่สุดตั้งแต่ปี 2020 มูลค่าหายไปกว่า 2.81 แสนล้านดอลลาร์ — มากที่สุดเป็นอันดับ 2 ในประวัติศาสตร์สหรัฐฯ)
$Meta Platforms (META.US)$ ...
2
1


