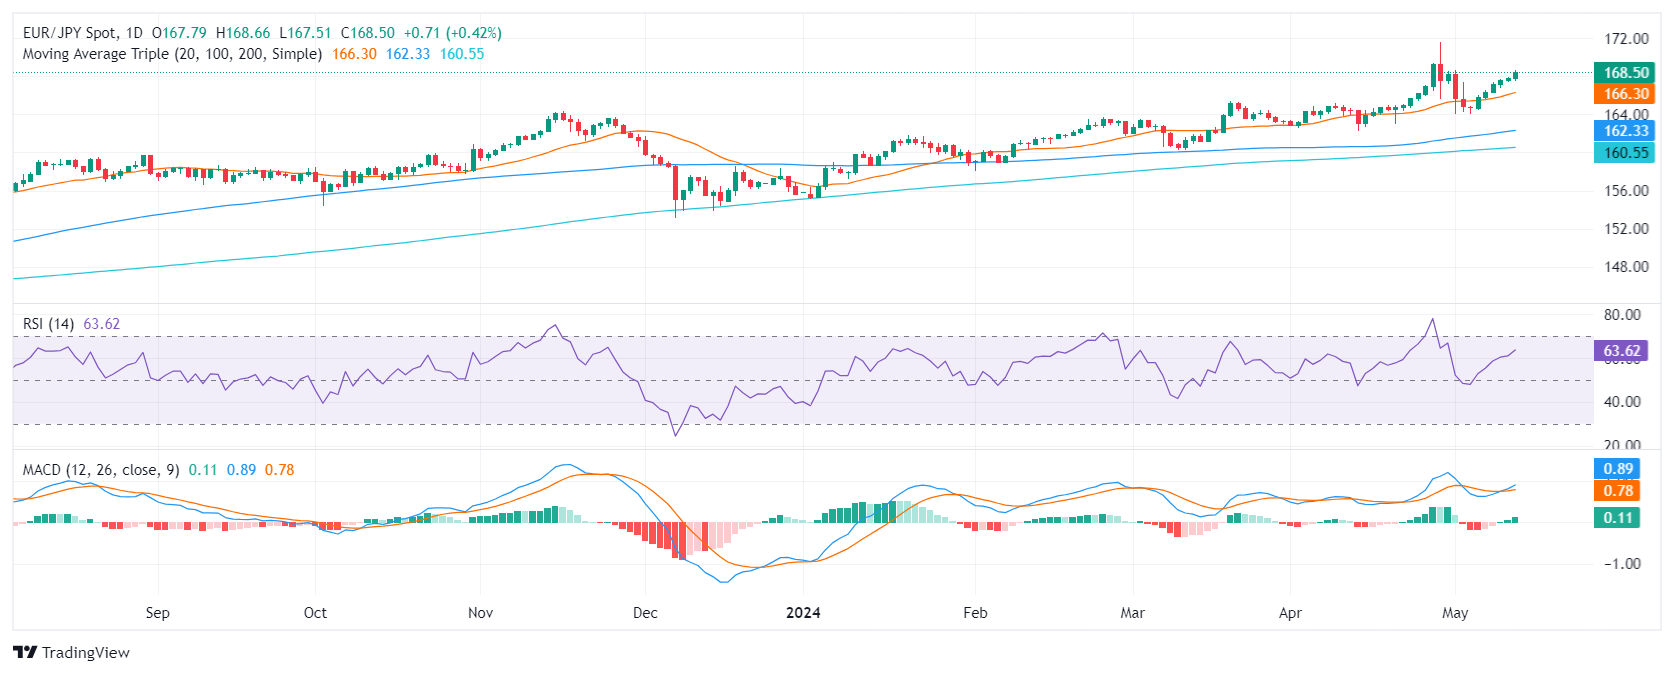
- The daily chart of the EUR/JPY reveals strong buying momentum, backed by positive RSI and MACD readings.
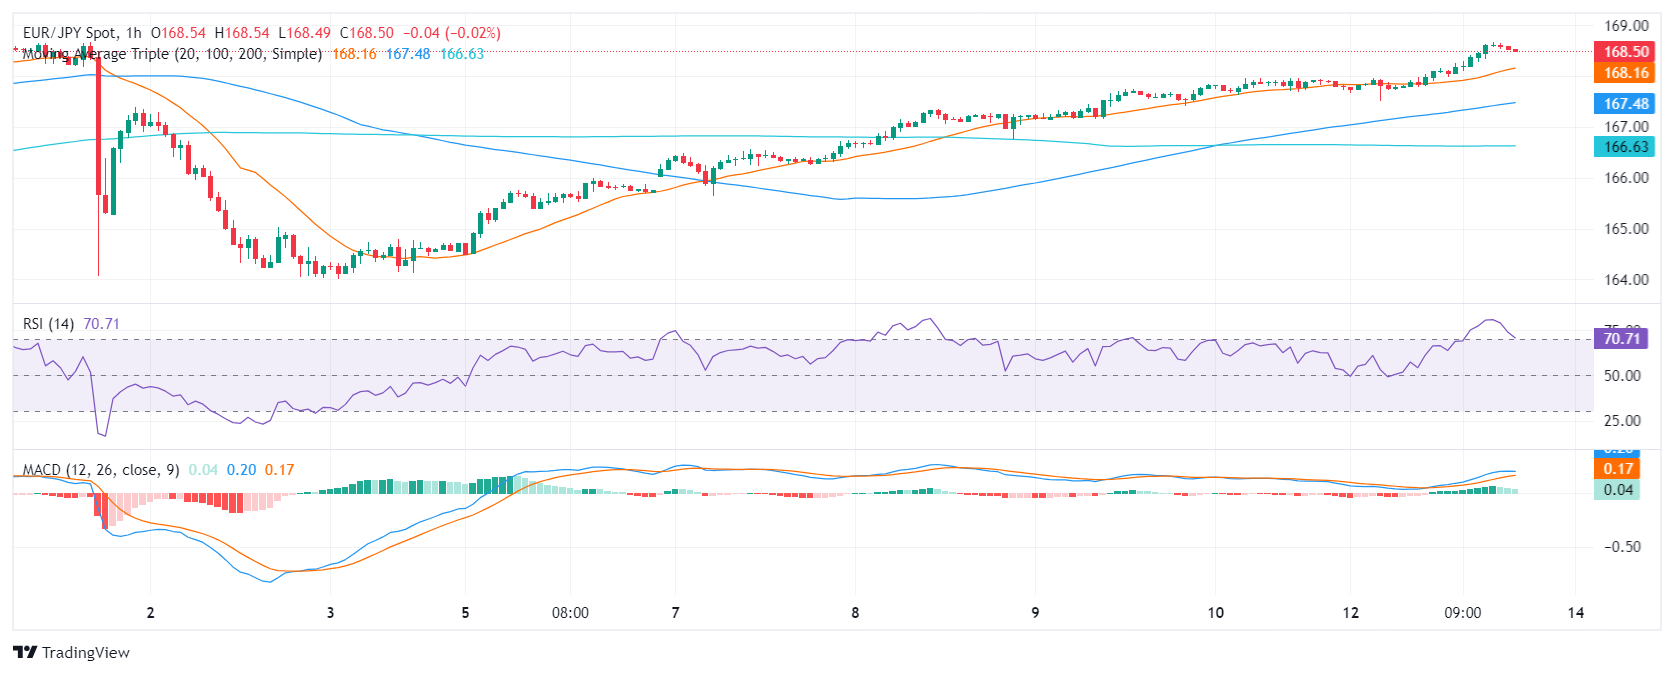
- Hourly chart indicators show a possible easing off from overbought status, potentially hinting at a nearing correction.
In Monday's session, the EUR/JPY pair showed strong bullish momentum, registering a rise to 168.52, marking a favorable 0.45% shift. However, potential short-term wavering observed in the hourly chart's indicators, suggests an approaching cooling-off phase, which could lead to profit-taking. As the ascent continues, investors are monitoring for a possible retest of the cycle highs above 170.00 in future sessions.
On the daily chart, the Relative Strength Index (RSI) is situated within the positive territory, signaling a buying bias. The consistent upward movement of the RSI, especially its peak at approximately 63, indicates strong buying momentum. Concurrently, the Moving Average Convergence Divergence (MACD) histogram shows increasing green bars, reinforcing the bullish outlook.
EUR/JPY daily chart

Moving to the hourly chart, the RSI shows heightened levels, consistently breaching the overbought threshold. A notable drop from approximately 80 to around 70 level, however, suggests a possible easing off from overbought status. Complementarily, the MACD on the hourly chart registers reducing green bars, implying a slowing pace of buying activity.
EUR/JPY hourly chart

Assessing the overall scenario, the EUR/JPY remains resilient around its Simple Moving Average (SMA) clusters. The pair is above the 20, 100, and 200-day SMA, important short- and long-term trend indicators, signifying a potential bullish bias in the near-term outlook. In addition, the pair being close to multi-year highs also paints with green the overall outlook.
Information on these pages contains forward-looking statements that involve risks and uncertainties. Markets and instruments profiled on this page are for informational purposes only and should not in any way come across as a recommendation to buy or sell in these assets. You should do your own thorough research before making any investment decisions. FXStreet does not in any way guarantee that this information is free from mistakes, errors, or material misstatements. It also does not guarantee that this information is of a timely nature. Investing in Open Markets involves a great deal of risk, including the loss of all or a portion of your investment, as well as emotional distress. All risks, losses and costs associated with investing, including total loss of principal, are your responsibility. The views and opinions expressed in this article are those of the authors and do not necessarily reflect the official policy or position of FXStreet nor its advertisers. The author will not be held responsible for information that is found at the end of links posted on this page.
If not otherwise explicitly mentioned in the body of the article, at the time of writing, the author has no position in any stock mentioned in this article and no business relationship with any company mentioned. The author has not received compensation for writing this article, other than from FXStreet.
FXStreet and the author do not provide personalized recommendations. The author makes no representations as to the accuracy, completeness, or suitability of this information. FXStreet and the author will not be liable for any errors, omissions or any losses, injuries or damages arising from this information and its display or use. Errors and omissions excepted.
The author and FXStreet are not registered investment advisors and nothing in this article is intended to be investment advice.
Recommended content
Editors’ Picks
AUD/USD defends gains near 0.6650 after mixed Australian data

AUD/USD caught a brief bid wave and edged toward 0.6700 after Australian CPI unexpectedly ticked higher to 3.6% YoY in April. However, a surprise drop in the country's Construction Output for Q1 curbs the Aussie's enthusiasm. A cautious mood also acts as a headwind for the pair.
USD/JPY trades firm above 157.00 amid dovish BoJ commentary, USD strength

USD/JPY is trading on a positive footing, comfortable above 157.00 in the Asian session on Wednesday. The pair holds higher ground after dovish comments from BoJ's official Adachi. Broad US Dollar strength also adds to the upside in the pair amid a risk-off environment.
Gold price gives up gains amid Fed’s hawkish remarks

Gold price snaps the three-day winning streak on Wednesday amid the modest rebound of the Greenback. Additionally, the hawkish remarks from several Federal Reserve officials and stronger-than-expected US economic data diminish expectations of the Fed rate cut in September.
Bitcoin long-term holders begin re-accumulation after Semler Scientific and Mt Gox make major whale moves

Bitcoin declined briefly from the $70,000 mark on Tuesday as Semler Scientific and Mt Gox made notable whale moves. Glassnode also shared key on-chain insights that breathe clarity into the market's current state.
Inflation week: Eyes on Germany’s numbers, Eurozone and the US PCE

Today we get Germany’s numbers and on Friday, both the Eurozone and the US PCE. For the Eurozone, expectations are for core to remain the same at 2.7% and for the ECB to cut in June. This is being named a “hawkish cut,” one of those inherently self-contradictory terms.