The Carlyle Group Inc's Dividend Analysis
Insights into Upcoming and Historical Dividend Performance
The Carlyle Group Inc (NASDAQ:CG) recently announced a dividend of $0.35 per share, payable on May 21, 2024, with the ex-dividend date set for May 13, 2024. As investors anticipate this upcoming payment, it's crucial to delve into the company's dividend history, yield, and growth rates. This analysis utilizes data from GuruFocus to evaluate the sustainability and performance of The Carlyle Group Inc's dividends.
What Does The Carlyle Group Inc Do?
This Powerful Chart Made Peter Lynch 29% A Year For 13 Years
How to calculate the intrinsic value of a stock?
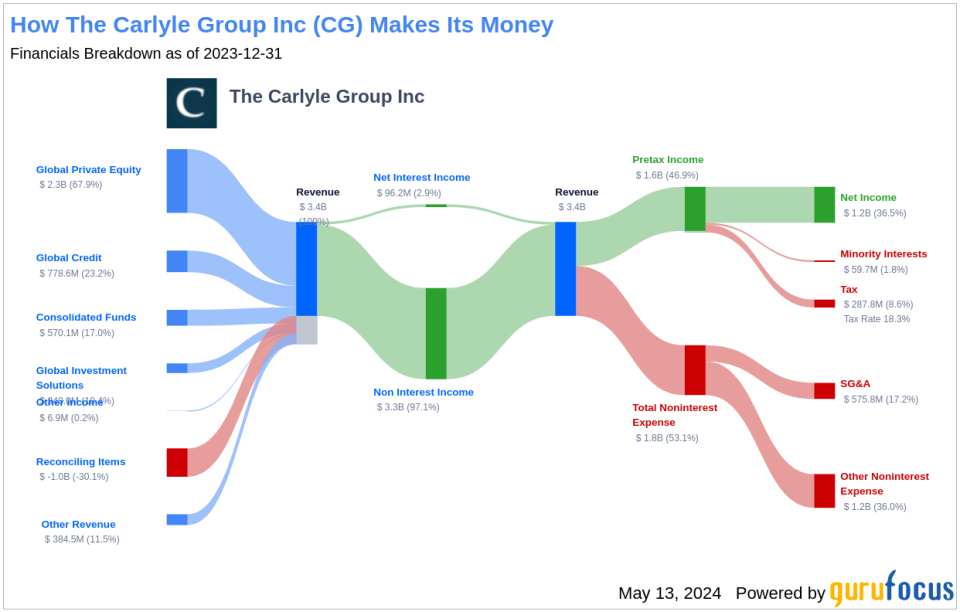
The Carlyle Group Inc is a leading global alternative-asset manager, boasting $426.0 billion in total assets under management (AUM) as of December 2023, which includes $307.4 billion in fee-earning AUM. The company operates through three core business segments: private equity (35% of fee-earning AUM and 63% of base management fees in 2023), global credit (50% and 25%), and investment solutions (15% and 12%). With 29 offices worldwide, The Carlyle Group Inc serves a diverse clientele of institutional investors and high-net-worth individuals across five continents.
A Glimpse at The Carlyle Group Inc's Dividend History
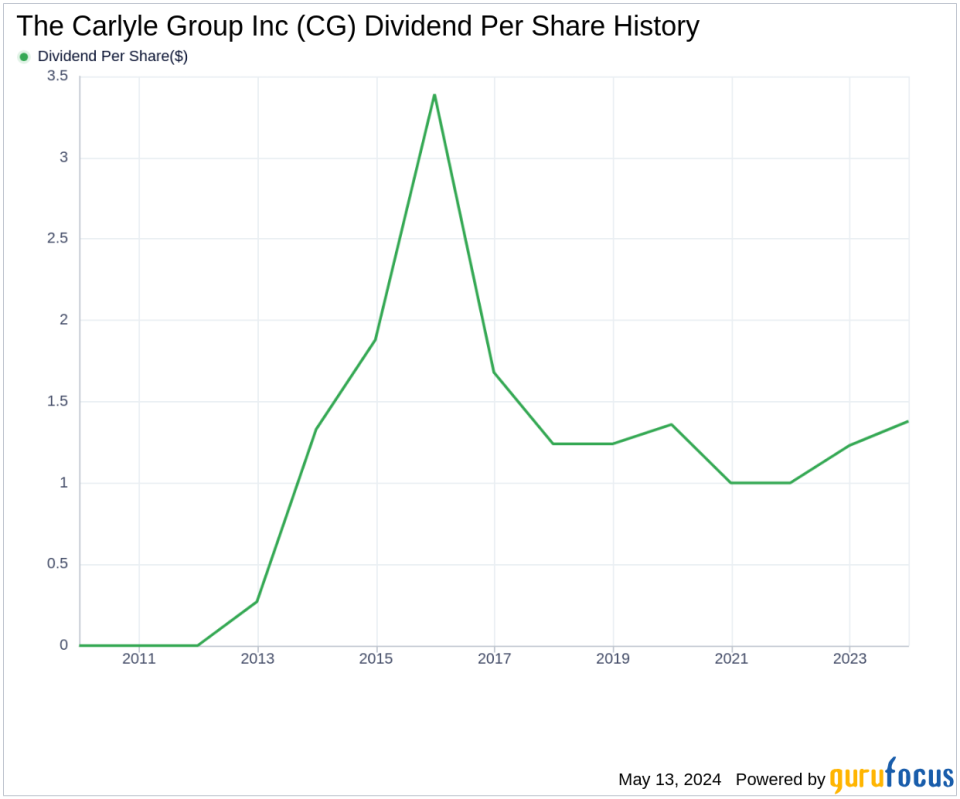
The Carlyle Group Inc has consistently paid dividends since 2012, with distributions occurring on a quarterly basis. Below is a chart illustrating the annual Dividends Per Share to track historical trends.
Breaking Down The Carlyle Group Inc's Dividend Yield and Growth
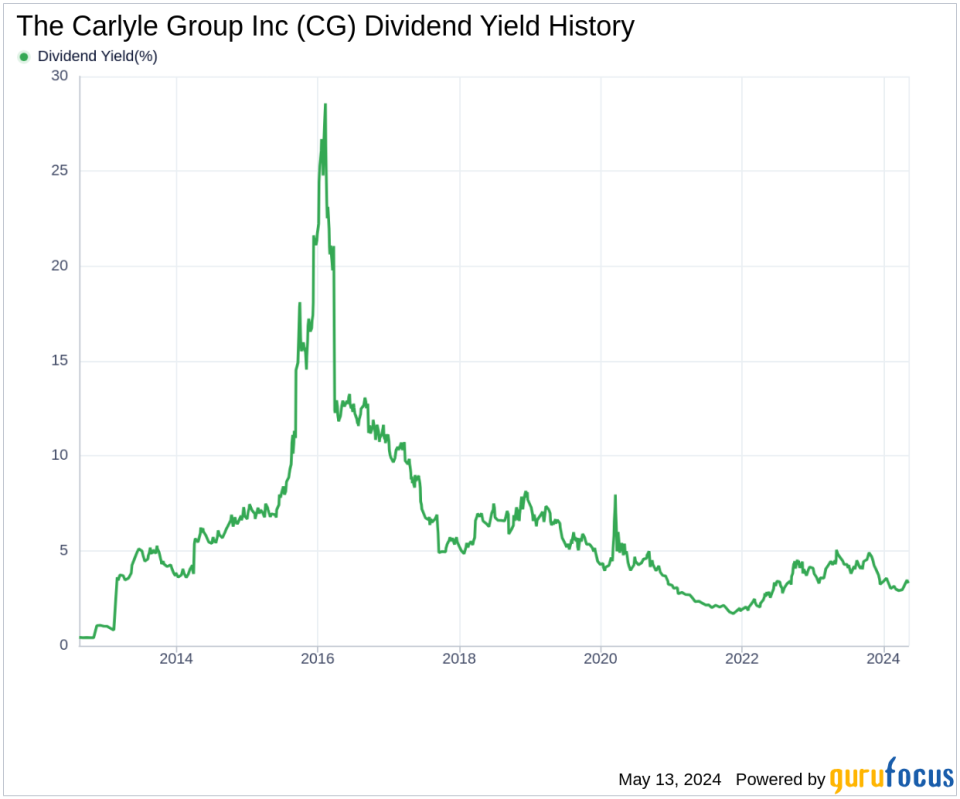
The Carlyle Group Inc currently boasts a trailing dividend yield of 3.29% and a forward dividend yield of 3.29%, indicating stable expected dividend payments over the next 12 months. Over the past three years, the annual dividend growth rate was 11.20%. However, this rate slowed to 0.60% per year over a five-year period and showed a decline of -5.40% over the past decade. As of today, the 5-year yield on cost for The Carlyle Group Inc stock is approximately 3.39%.
The Sustainability Question: Payout Ratio and Profitability
Assessing the sustainability of dividends involves examining the dividend payout ratio, which is currently 0.00, indicating that The Carlyle Group Inc retains all its earnings. Despite this, the company's profitability rank stands at 3 out of 10, suggesting challenges in sustaining dividends, especially given that the company reported net profit in only 8 out of the past 10 years.
Growth Metrics: The Future Outlook
The Carlyle Group Inc's growth rank is also 3 out of 10, indicating poor growth prospects which may impact dividend sustainability. Despite a strong revenue model as suggested by the revenue per share, the company's 3-year revenue growth rate of approximately -11.20% annually underperforms 74% of global competitors.
Conclusion
Considering The Carlyle Group Inc's dividend payments, growth rate, payout ratio, profitability, and growth metrics, investors should maintain a cautious outlook regarding the sustainability of future dividends. For those interested in exploring high-dividend yield opportunities, the High Dividend Yield Screener available to GuruFocus Premium users may provide valuable insights.
This article, generated by GuruFocus, is designed to provide general insights and is not tailored financial advice. Our commentary is rooted in historical data and analyst projections, utilizing an impartial methodology, and is not intended to serve as specific investment guidance. It does not formulate a recommendation to purchase or divest any stock and does not consider individual investment objectives or financial circumstances. Our objective is to deliver long-term, fundamental data-driven analysis. Be aware that our analysis might not incorporate the most recent, price-sensitive company announcements or qualitative information. GuruFocus holds no position in the stocks mentioned herein.
This article first appeared on GuruFocus.

 Yahoo Finance


