Sally Beauty Holdings Inc (SBH) Q2 Fiscal 2024 Earnings: A Detailed Review
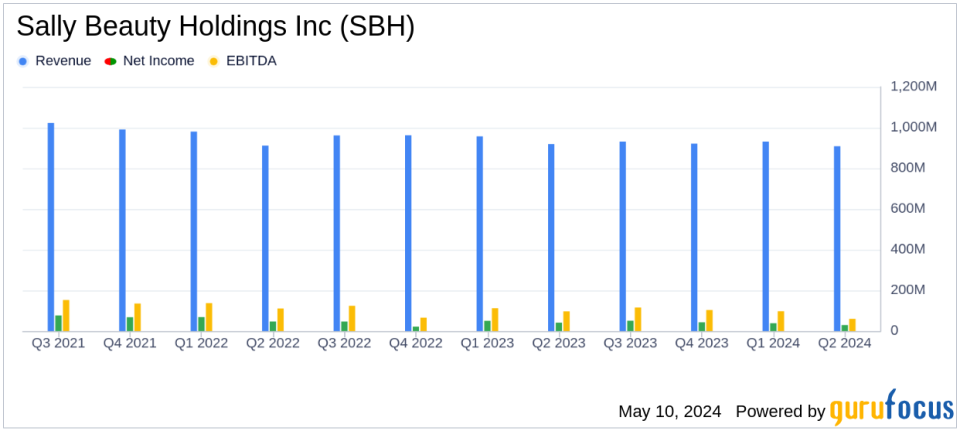
Revenue: Reported at $908 million, marking a decrease of 1.1% year-over-year, falling short of the estimated $939.89 million.
Net Income: Achieved $29.2 million, down 28.4% year-over-year, far below below the estimated $59.46 million.
Earnings Per Share (EPS): Adjusted EPS stood at $0.35, far below the estimated $0.55.
Operating Free Cash Flow: Recorded at $23 million, with a total cash flow from operations of $37 million.
Gross Margin: Maintained at 51.0%, consistent with the previous year, despite a challenging economic environment.
Global E-commerce Sales: Totaled $90 million, representing 9.9% of net sales, highlighting ongoing digital sales strength.
Store Count: Slightly reduced to 3,134 from 3,143 year-over-year, reflecting a modest consolidation of retail locations.
Sally Beauty Holdings Inc (NYSE:SBH) released its 8-K filing on May 9, 2024, revealing the financial outcomes for its second quarter ended March 31, 2024. The professional beauty-products retailer, operating globally through its Sally Beauty Supply and Beauty Systems Group segments, reported a slight downturn in its quarterly performance influenced by economic pressures, yet continued to advance strategic growth initiatives.

Financial Performance Overview
Sally Beauty Holdings reported consolidated net sales of $908 million for the quarter, marking a 1.1% decrease compared to the previous year. This figure fell short of analyst expectations which estimated revenue at $939.89 million. The company's GAAP diluted net earnings per share stood at $0.27, significantly lower than the estimated $0.55, with adjusted diluted net earnings per share at $0.35.
The decline in sales was primarily attributed to a 1.5% drop in consolidated comparable sales, reflecting subdued customer traffic and purchasing patterns at Sally Beauty, which were partially offset by positive trends in the Beauty Systems Group segment. The company's gross margin remained stable at 51.0%, while operating earnings decreased to $59.6 million from $71.4 million in the prior year.
Despite these challenges, Sally Beauty demonstrated operational resilience by generating $37 million in cash flow from operations and executing $20 million in share repurchases. The company also completed a strategic refinancing of its $680 million senior unsecured note due in 2025, extending the maturity to 2032 and potentially easing near-term financial pressures.
Strategic and Operational Highlights
Denise Paulonis, President and CEO of Sally Beauty Holdings, highlighted the benefits of expanded distribution and product innovation, particularly within the Beauty Systems Group. Paulonis noted the adverse impact of an inflationary environment on customer behavior but remained optimistic about the company's strategic direction and its focus on long-term growth and profitability.
The company's balance sheet showed $97 million in cash and cash equivalents and a net debt leverage ratio of 2.2x. Inventory levels rose slightly by 1.6% compared to the previous year, indicating managed expectations in product demand.
Segment Performance and Future Outlook
The Sally Beauty Supply segment experienced a 3.2% decline in net sales, while the Beauty Systems Group segment saw a 1.7% increase, underscoring divergent trends within the company's operational arms. Looking ahead, Sally Beauty has updated its fiscal 2024 guidance, anticipating flat net sales and comparable sales year-over-year, with a gross margin projection of 50.5% to 51.0% and an adjusted operating margin of approximately 8.5%.
The company plans to continue its focus on strategic initiatives, including enhancing its e-commerce platform, which currently represents 9.9% of net sales, and optimizing its product mix to better align with evolving consumer preferences.
Investor and Analyst Perspectives
While the quarter presented financial challenges, the strategic moves to strengthen the company's balance sheet and streamline operations could position Sally Beauty for a rebound as market conditions stabilize. Investors and analysts will likely watch closely how the company's adjustments in strategy and operations translate into financial performance in the coming quarters.
For more detailed information and to stay updated on Sally Beauty Holdings Inc's financial performance, visit the Investor Relations section of their website or join their upcoming earnings call.
Explore the complete 8-K earnings release (here) from Sally Beauty Holdings Inc for further details.
This article first appeared on GuruFocus.

 Yahoo Finance