Breakout or breakdown? Let’s examine three of the top market-cap cryptocurrencies and determine their bullish and bearish cases.
Bitcoin
For Bitcoin (BTC-USD), the word for the day and week is choppy. BTC is well above the 200-day moving average at $52,000 and just a hair below the 20-day moving average at $65,000. Since falling below the 20-day moving average on March 24, bulls have been unable or unwilling to return and stay above that level.
The Composite Index is sitting in neutral territory, but the present angle of the line means it will cross above both of its moving averages by Thursday if the angle remains the same. However, the Detrended Price Oscillator (DTO) may be the most important indicator to watch.
Generally, when the DTO crosses the zero line, it can be a strong trigger for identifying the near-term trade direction. The DTO crossed below the zero line on March 26, but price action failed to follow through so far. If it crosses back above the zero line and BTC closes above the 20-day moving average, that could be a strong warning sign that the bulls are back in control.
For the bears, they’ll be watching the DTO closely for a rejection of any crossover and failure to close above the zero line. In that instance, bearish price action is the most probable direction ahead.

Ethereum
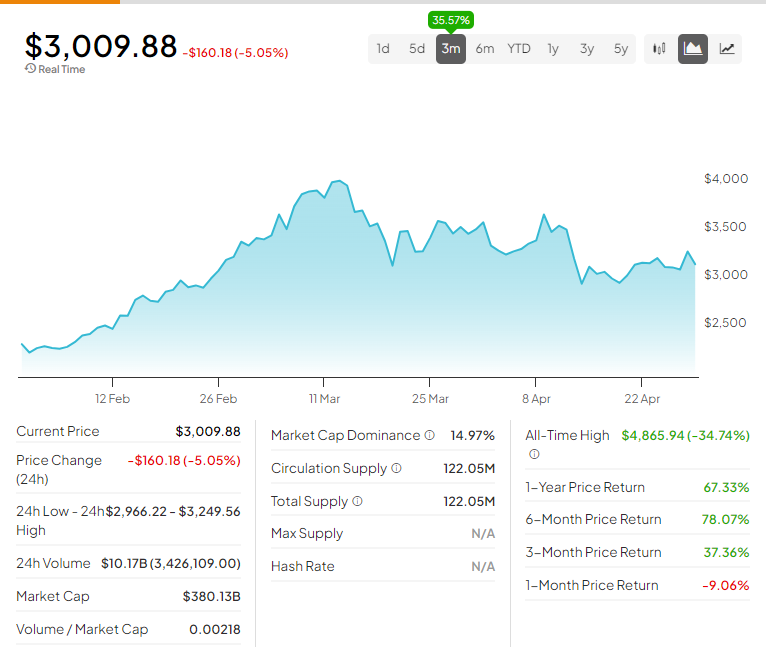
Ethereum (ETH-USD) outperformed its peers last week, but does that mean it will continue its hot streak? Its 200-day moving average is at $2,676, which is below ETH’s current price but certainly closer to the current close than BTC is from its 200-day moving average.
The 20-day moving average is proving to be a headache for bears and bulls alike. Since April 23, traders have been battling against it without any clear sign of bulls or bears taking control.
If bulls break out above the 20-day moving average, the next resistance zone is at $3,700. Bears are likely frothing at the mouth for a clear breakdown below the bear flag. However, given the congested nature and failure of the bears to capitalize on a series of short opportunities, bulls might surprise the market.

Solana
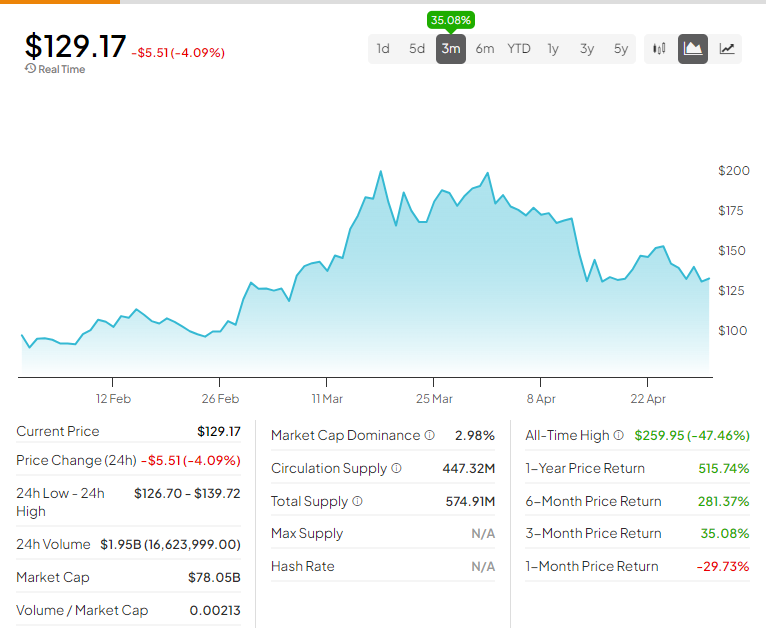
Solana (SOL-USD) has not had an easy time lately. With congestion on its network, massive transaction failures, and memecoins popping up more frequently than a bad case of herpes, SOL’s seen better days. The closest support zone for bulls is the 200-day moving average at $112.78, with near-term resistance against the 20-day moving average at $148.32. Above that, the recent swing high between $200 and $205 will be the next major zone for bulls to test.
SOL’s Composite Index and DTO do little to provide a directional bias in the short term. The Composite Index is in neutral conditions. The DTO is below the zero line, but strong selling pressure hasn’t occurred – yet.

Don’t let crypto give you a run for your money. Track coin prices here


