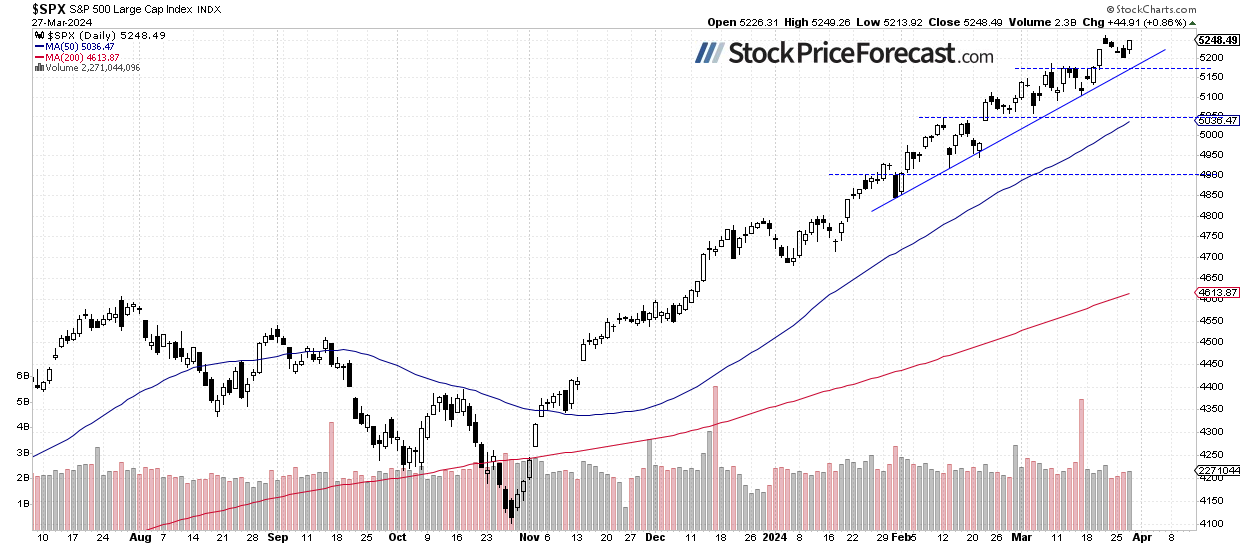
Stock prices broke their short-term losing streak yesterday, as the S&P 500 index gained 0.86%. Earlier this week, the market kept retracing its last week’s record-breaking rally; however, it was doing so at a very slow pace. Last Thursday, the S&P 500 reached a record high of 5,261.10, and on Tuesday, it traded as low as 5,203.42. Last week, stock prices were influenced by the FOMC Rate Decision on Wednesday; this week, investors are bracing for economic data releases, including tomorrow’s Friday’s Core PCE Price Index. However, with as the long holiday weekend approaching, volatility may be decreasing.
This morning, the S&P 500 futures contract is gaining 0.1%, indicating a neutral opening of the index. The question remains: will the last Thursday’s surge lead to a downward correction and a potential retracement of the advance? From a contrarian standpoint, such a correction seems likely, but the overall trend remains bullish.
On March 1, I mentioned about February, “Despite concerns about stock valuations, the market rallied to new record highs, fueled by hopes of the Fed's monetary policy pivot and the AI revolution.”. And last week, it was all about that Fed pivot, hence a positive market reaction. The S&P 500 index still seems to be crawling a wall of worry here.
While indexes were hitting new record highs, most stocks were essentially moving sideways. So, the question is – is this a topping pattern before a more meaningful correction? Still, there have been no confirmed negative signals; however, one might consider the possibility of a trend reversal.
The investor sentiment much improved; yesterday’s AAII Investor Sentiment Survey showed that 50.0% of individual investors are bullish, while only 22.4% of them are bearish, down from 27.2% last week. The AAII sentiment is a contrary indicator in the sense that highly bullish readings may suggest excessive complacency and a lack of fear in the market. Conversely, bearish readings are favorable for market upturns.
The S&P 500 index continues to trade above its over month-long upward trend line again, as we can see on the daily chart.
Nasdaq 100 bounced from 18,200
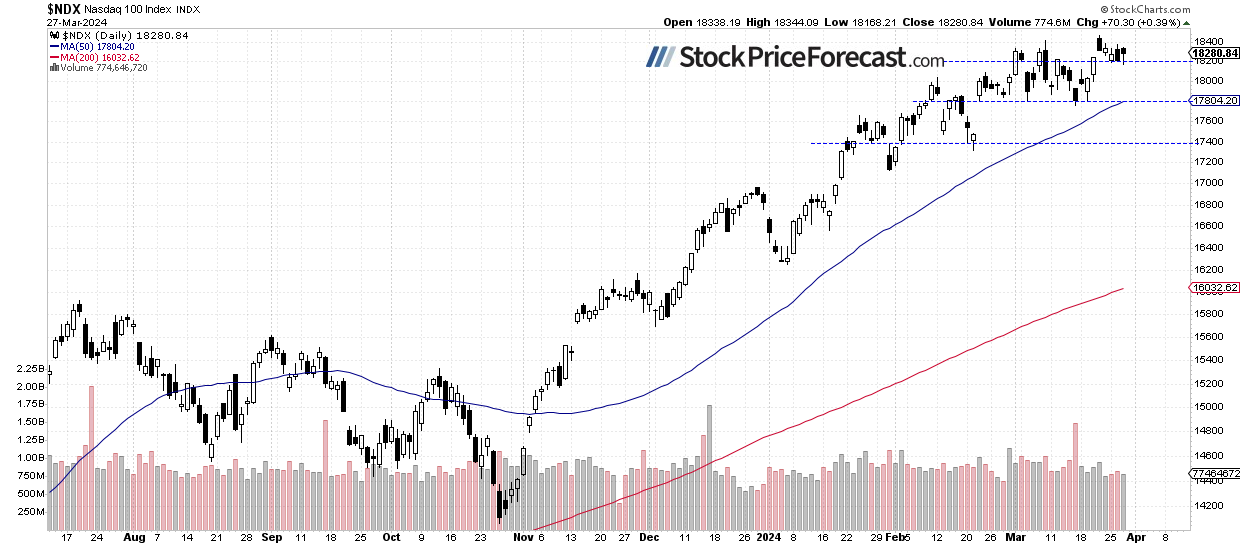
Last Thursday, the technology-focused Nasdaq 100 index reached a new record high of 18,464.70, extending its long-term uptrend yet again. However, this week, it went back slightly below the 18,200 level, before bouncing and gaining 0.39% yesterday. The market retreated back within the recent consolidation, indicating a failed breakout attempt. The short-term support level remains at 18,200.
VIX remains close to 133
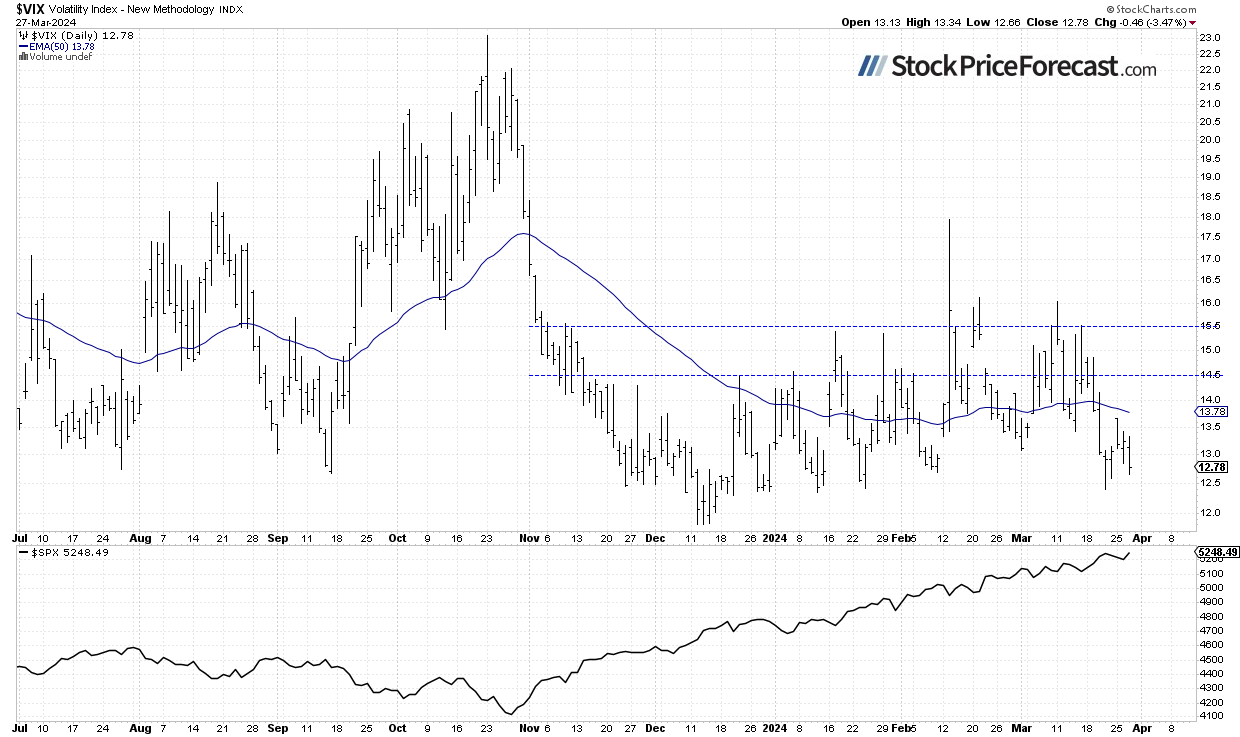
The VIX index, also known as the fear gauge, is derived from option prices. Last Thursday, the index dipped slightly below the 12.50 level, before bouncing closer to 13 later in the day. It was the lowest since mid-January, indicating a lack of fear in the market. Yesterday, it kept fluctuating along the 13 level, before closing below that level on advancing stock prices.
Historically, a dropping VIX indicates less fear in the market, and rising VIX accompanies stock market downturns. However, the lower the VIX, the higher the probability of the market’s downward reversal.
Futures contract is above 5,300 again
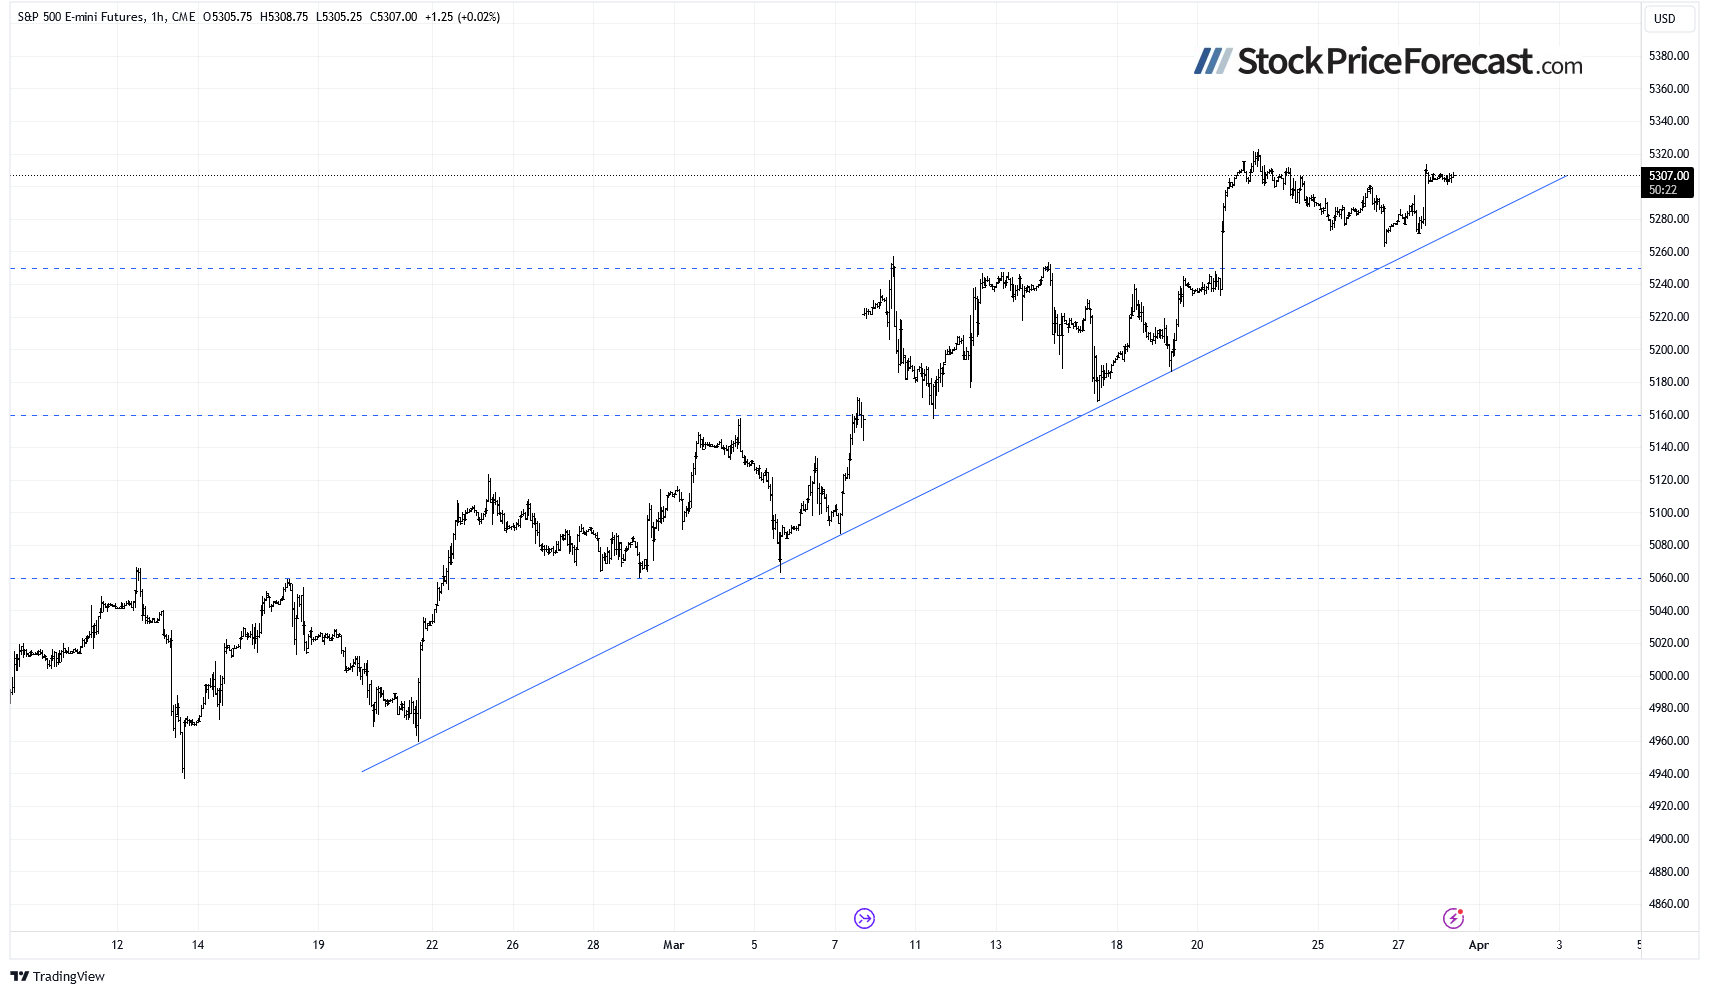
Let’s take a look at the hourly chart of the S&P 500 futures contract. This morning, it’s trading slightly above the 5,300 level again, following yesterday’s rebound. The resistance level is at 5,320, marked by the record high, and the support level remains at 5,260, marked by the previous highs.
Conclusion
Today, the S&P 500 index is likely to open virtually flat. The market is basically still going sideways following last week’s advances. More pronounced profit-taking action may be in cards at some point. However, as of now, there have been no confirmed negative signals.
In my Stock Price Forecast for March, I noted “So far, stock prices have been trending upwards in the medium to long term, reaching new record highs. The prudent advice one could give right now is to remain bullish or stay on the sidelines if one believes stocks are becoming overvalued and may need a correction. It's likely that the S&P 500 will continue its bull run this month. However, we may encounter a correction or increased volatility at some point as investors start to take profits off the table.”
For now, my short-term outlook remains neutral.
Here’s the breakdown:
-
The S&P 500 is likely to extend a short-term consolidation following last week’s rally, with markets anticipating a long holiday weekend.
-
In the medium term, stock prices are overbought, suggesting the potential for a correction.
-
In my opinion, the short-term outlook is neutral.
Want free follow-ups to the above article and details not available to 99%+ investors? Sign up to our free newsletter today!
All essays, research and information found above represent analyses and opinions of Przemyslaw Radomski, CFA and Sunshine Profits' employees and associates only. As such, it may prove wrong and be a subject to change without notice. Opinions and analyses were based on data available to authors of respective essays at the time of writing. Although the information provided above is based on careful research and sources that are believed to be accurate, Przemyslaw Radomski, CFA and his associates do not guarantee the accuracy or thoroughness of the data or information reported. The opinions published above are neither an offer nor a recommendation to purchase or sell any securities. Mr. Radomski is not a Registered Securities Advisor. By reading Przemyslaw Radomski's, CFA reports you fully agree that he will not be held responsible or liable for any decisions you make regarding any information provided in these reports. Investing, trading and speculation in any financial markets may involve high risk of loss. Przemyslaw Radomski, CFA, Sunshine Profits' employees and affiliates as well as members of their families may have a short or long position in any securities, including those mentioned in any of the reports or essays, and may make additional purchases and/or sales of those securities without notice.
Recommended content
Editors’ Picks
EUR/USD edges lower toward 1.0700 post-US PCE

EUR/USD stays under modest bearish pressure but manages to hold above 1.0700 in the American session on Friday. The US Dollar (USD) gathers strength against its rivals after the stronger-than-forecast PCE inflation data, not allowing the pair to gain traction.
GBP/USD retreats to 1.2500 on renewed USD strength

GBP/USD lost its traction and turned negative on the day near 1.2500. Following the stronger-than-expected PCE inflation readings from the US, the USD stays resilient and makes it difficult for the pair to gather recovery momentum.
Gold struggles to hold above $2,350 following US inflation

Gold turned south and declined toward $2,340, erasing a large portion of its daily gains, as the USD benefited from PCE inflation data. The benchmark 10-year US yield, however, stays in negative territory and helps XAU/USD limit its losses.
Bitcoin Weekly Forecast: BTC’s next breakout could propel it to $80,000 Premium

Bitcoin’s recent price consolidation could be nearing its end as technical indicators and on-chain metrics suggest a potential upward breakout. However, this move would not be straightforward and could punish impatient investors.
Week ahead – Hawkish risk as Fed and NFP on tap, Eurozone data eyed too

Fed meets on Wednesday as US inflation stays elevated. Will Friday’s jobs report bring relief or more angst for the markets? Eurozone flash GDP and CPI numbers in focus for the Euro.


