Investors Holding Back On Malayan United Industries Berhad (KLSE:MUIIND)
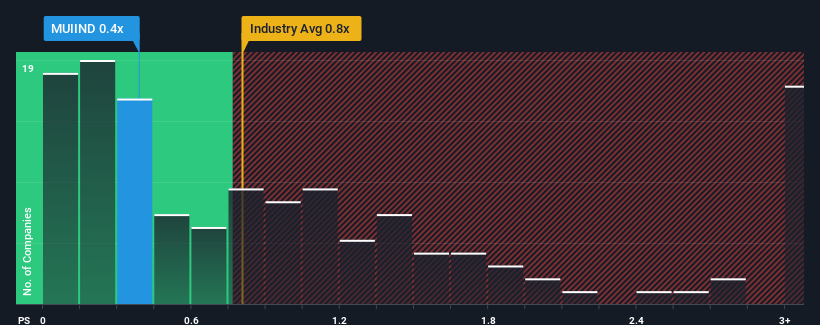
With a median price-to-sales (or "P/S") ratio of close to 0.8x in the Industrials industry in Malaysia, you could be forgiven for feeling indifferent about Malayan United Industries Berhad's (KLSE:MUIIND) P/S ratio of 0.4x. Although, it's not wise to simply ignore the P/S without explanation as investors may be disregarding a distinct opportunity or a costly mistake.
View our latest analysis for Malayan United Industries Berhad
What Does Malayan United Industries Berhad's Recent Performance Look Like?
Recent times have been quite advantageous for Malayan United Industries Berhad as its revenue has been rising very briskly. Perhaps the market is expecting future revenue performance to taper off, which has kept the P/S from rising. If that doesn't eventuate, then existing shareholders have reason to be feeling optimistic about the future direction of the share price.
Want the full picture on earnings, revenue and cash flow for the company? Then our free report on Malayan United Industries Berhad will help you shine a light on its historical performance.
Do Revenue Forecasts Match The P/S Ratio?
Malayan United Industries Berhad's P/S ratio would be typical for a company that's only expected to deliver moderate growth, and importantly, perform in line with the industry.
Taking a look back first, we see that the company grew revenue by an impressive 86% last year. The latest three year period has also seen an excellent 41% overall rise in revenue, aided by its short-term performance. Accordingly, shareholders would have definitely welcomed those medium-term rates of revenue growth.
This is in contrast to the rest of the industry, which is expected to grow by 1.0% over the next year, materially lower than the company's recent medium-term annualised growth rates.
In light of this, it's curious that Malayan United Industries Berhad's P/S sits in line with the majority of other companies. Apparently some shareholders believe the recent performance is at its limits and have been accepting lower selling prices.
The Bottom Line On Malayan United Industries Berhad's P/S
While the price-to-sales ratio shouldn't be the defining factor in whether you buy a stock or not, it's quite a capable barometer of revenue expectations.
To our surprise, Malayan United Industries Berhad revealed its three-year revenue trends aren't contributing to its P/S as much as we would have predicted, given they look better than current industry expectations. It'd be fair to assume that potential risks the company faces could be the contributing factor to the lower than expected P/S. It appears some are indeed anticipating revenue instability, because the persistence of these recent medium-term conditions would normally provide a boost to the share price.
Before you take the next step, you should know about the 3 warning signs for Malayan United Industries Berhad (1 shouldn't be ignored!) that we have uncovered.
If you're unsure about the strength of Malayan United Industries Berhad's business, why not explore our interactive list of stocks with solid business fundamentals for some other companies you may have missed.
Have feedback on this article? Concerned about the content? Get in touch with us directly. Alternatively, email editorial-team (at) simplywallst.com.
This article by Simply Wall St is general in nature. We provide commentary based on historical data and analyst forecasts only using an unbiased methodology and our articles are not intended to be financial advice. It does not constitute a recommendation to buy or sell any stock, and does not take account of your objectives, or your financial situation. We aim to bring you long-term focused analysis driven by fundamental data. Note that our analysis may not factor in the latest price-sensitive company announcements or qualitative material. Simply Wall St has no position in any stocks mentioned.
Join A Paid User Research Session
You’ll receive a US$30 Amazon Gift card for 1 hour of your time while helping us build better investing tools for the individual investors like yourself. Sign up here

 Yahoo Finance
