
Direxion Daily Semiconductor Bull 3X Shares (NYSE:SOXL) skyrocketed almost 20% higher last Friday and printed a massive bullish kicker candlestick on the daily chart.
The semiconductor sector has seen bullish momentum since NVIDIA Corporation (NASDAQ:NVDA) reported its quarterly earnings, which caused the stock to reach a new all-time high. SOXL is a triple-leveraged fund that consists of a variety of stocks in the semiconductor sector. Advanced Micro Devices, Inc (NASDAQ:AMD) makes up 7.03% of the fund, while Nvidia is weighted at 8.81%.
Tech stocks, including chipmaker stocks, have enjoyed bullish price action recently, matching the positive movements seen in the general markets. On Friday, the S&P 500 closed just under a heavy resistance level near $420 and if the market ETF can regain the level as support, tech stocks could run higher.
Must Read: A Look At The SPY Heading Into The Week With Biden's Tentative Debt Ceiling Deal In Focus
Traders who are bearish on the semiconductor sector can track the Direxion Daily Semiconductor Bear 3X Shares (NYSE:SOXS).
Want direct analysis? Find me in the BZ Pro lounge! Click here for a free trial.
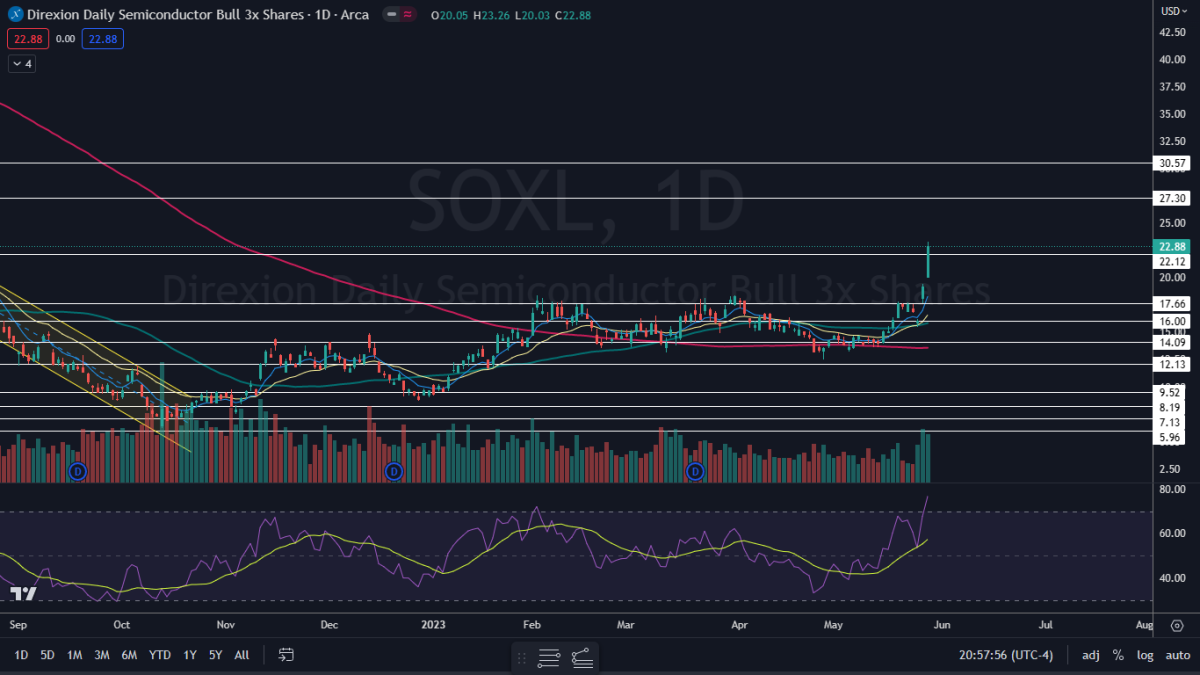
The SOXL Chart: SOXL gapped up to open Friday's trading session and closed near the high-of-day, which caused the ETF to print a bullish kicker candlestick. The candlestick suggests SOXL could trade higher again on Monday.
- The move higher on Thursday and Friday also appears to be an upward break from a bull flag pattern on the daily chart. The formation was created between May 15 and May 23, with a measured move of almost 27%, which suggests SOXL could run up toward the $21 mark, but the ETF has already surpassed that.
- If SOXL fails to trade higher on Monday, the next most likely scenario is that the ETF consolidates sideways and forms an inside bar pattern. If that happens, the pattern leans bullish for continuation.
- Eventual consolidation is also likely to take place over the next few days because SOXL's relative strength index (RSI) reached about 76% on Friday. When a stock or ETF's RSI reaches or exceeds the 70% mark it becomes overbought, which can be a sell signal for technical traders.
- SOXL has resistance above at $27.30 and $30.57 and support below at $22.12 and $17.66.
Read Next: Nvidia CEO Calls For Urgent Action: Embrace AI Or Risk Being Left Behind
Photo: Shutterstock