
Key Insights
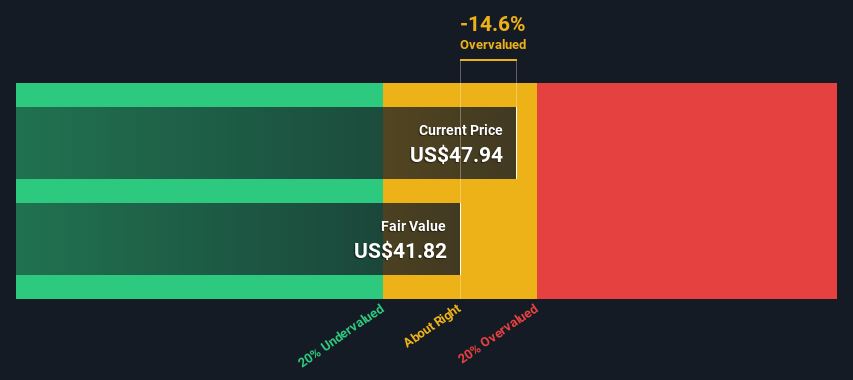
- The projected fair value for H World Group is US$41.82 based on 2 Stage Free Cash Flow to Equity
- Current share price of US$47.94 suggests H World Group is potentially trading close to its fair value
- The CN¥57.56 analyst price target for HTHT is 38% more than our estimate of fair value
Today we'll do a simple run through of a valuation method used to estimate the attractiveness of H World Group Limited (NASDAQ:HTHT) as an investment opportunity by projecting its future cash flows and then discounting them to today's value. One way to achieve this is by employing the Discounted Cash Flow (DCF) model. Models like these may appear beyond the comprehension of a lay person, but they're fairly easy to follow.
We would caution that there are many ways of valuing a company and, like the DCF, each technique has advantages and disadvantages in certain scenarios. Anyone interested in learning a bit more about intrinsic value should have a read of the Simply Wall St analysis model.
View our latest analysis for H World Group
The Model
We're using the 2-stage growth model, which simply means we take in account two stages of company's growth. In the initial period the company may have a higher growth rate and the second stage is usually assumed to have a stable growth rate. To begin with, we have to get estimates of the next ten years of cash flows. Where possible we use analyst estimates, but when these aren't available we extrapolate the previous free cash flow (FCF) from the last estimate or reported value. We assume companies with shrinking free cash flow will slow their rate of shrinkage, and that companies with growing free cash flow will see their growth rate slow, over this period. We do this to reflect that growth tends to slow more in the early years than it does in later years.
Generally we assume that a dollar today is more valuable than a dollar in the future, so we need to discount the sum of these future cash flows to arrive at a present value estimate:
10-year free cash flow (FCF) estimate
| 2023 | 2024 | 2025 | 2026 | 2027 | 2028 | 2029 | 2030 | 2031 | 2032 | |
| Levered FCF (CN¥, Millions) | CN¥4.62b | CN¥4.19b | CN¥5.74b | CN¥6.93b | CN¥7.98b | CN¥8.88b | CN¥9.63b | CN¥10.3b | CN¥10.8b | CN¥11.3b |
| Growth Rate Estimate Source | Analyst x2 | Analyst x3 | Analyst x2 | Est @ 20.78% | Est @ 15.16% | Est @ 11.24% | Est @ 8.49% | Est @ 6.56% | Est @ 5.21% | Est @ 4.27% |
| Present Value (CN¥, Millions) Discounted @ 11% | CN¥4.2k | CN¥3.4k | CN¥4.2k | CN¥4.6k | CN¥4.8k | CN¥4.8k | CN¥4.7k | CN¥4.5k | CN¥4.3k | CN¥4.1k |
("Est" = FCF growth rate estimated by Simply Wall St)
Present Value of 10-year Cash Flow (PVCF) = CN¥44b
We now need to calculate the Terminal Value, which accounts for all the future cash flows after this ten year period. For a number of reasons a very conservative growth rate is used that cannot exceed that of a country's GDP growth. In this case we have used the 5-year average of the 10-year government bond yield (2.1%) to estimate future growth. In the same way as with the 10-year 'growth' period, we discount future cash flows to today's value, using a cost of equity of 11%.
Terminal Value (TV)= FCF2032 × (1 + g) ÷ (r – g) = CN¥11b× (1 + 2.1%) ÷ (11%– 2.1%) = CN¥133b
Present Value of Terminal Value (PVTV)= TV / (1 + r)10= CN¥133b÷ ( 1 + 11%)10= CN¥48b
The total value, or equity value, is then the sum of the present value of the future cash flows, which in this case is CN¥92b. The last step is to then divide the equity value by the number of shares outstanding. Relative to the current share price of US$47.9, the company appears around fair value at the time of writing. Remember though, that this is just an approximate valuation, and like any complex formula - garbage in, garbage out.
The Assumptions
Now the most important inputs to a discounted cash flow are the discount rate, and of course, the actual cash flows. Part of investing is coming up with your own evaluation of a company's future performance, so try the calculation yourself and check your own assumptions. The DCF also does not consider the possible cyclicality of an industry, or a company's future capital requirements, so it does not give a full picture of a company's potential performance. Given that we are looking at H World Group as potential shareholders, the cost of equity is used as the discount rate, rather than the cost of capital (or weighted average cost of capital, WACC) which accounts for debt. In this calculation we've used 11%, which is based on a levered beta of 1.209. Beta is a measure of a stock's volatility, compared to the market as a whole. We get our beta from the industry average beta of globally comparable companies, with an imposed limit between 0.8 and 2.0, which is a reasonable range for a stable business.
SWOT Analysis for H World Group
- No major strengths identified for HTHT.
- Expensive based on P/S ratio and estimated fair value.
- Expected to breakeven next year.
- Has sufficient cash runway for more than 3 years based on current free cash flows.
- Have HTHT insiders been buying lately?
- Debt is not well covered by operating cash flow.
- Is HTHT well equipped to handle threats?
Moving On:
Whilst important, the DCF calculation ideally won't be the sole piece of analysis you scrutinize for a company. It's not possible to obtain a foolproof valuation with a DCF model. Rather it should be seen as a guide to "what assumptions need to be true for this stock to be under/overvalued?" For example, changes in the company's cost of equity or the risk free rate can significantly impact the valuation. For H World Group, there are three pertinent elements you should assess:
- Risks: Take risks, for example - H World Group has 1 warning sign we think you should be aware of.
- Future Earnings: How does HTHT's growth rate compare to its peers and the wider market? Dig deeper into the analyst consensus number for the upcoming years by interacting with our free analyst growth expectation chart.
- Other Solid Businesses: Low debt, high returns on equity and good past performance are fundamental to a strong business. Why not explore our interactive list of stocks with solid business fundamentals to see if there are other companies you may not have considered!
PS. The Simply Wall St app conducts a discounted cash flow valuation for every stock on the NASDAQGS every day. If you want to find the calculation for other stocks just search here.
Have feedback on this article? Concerned about the content? Get in touch with us directly. Alternatively, email editorial-team (at) simplywallst.com.
This article by Simply Wall St is general in nature. We provide commentary based on historical data and analyst forecasts only using an unbiased methodology and our articles are not intended to be financial advice. It does not constitute a recommendation to buy or sell any stock, and does not take account of your objectives, or your financial situation. We aim to bring you long-term focused analysis driven by fundamental data. Note that our analysis may not factor in the latest price-sensitive company announcements or qualitative material. Simply Wall St has no position in any stocks mentioned.