
By buying an index fund, you can roughly match the market return with ease. But if you choose individual stocks with prowess, you can make superior returns. For example, Tianjin Pharmaceutical Da Ren Tang Group Corporation Limited (SGX:T14) shareholders have seen the share price rise 44% over three years, well in excess of the market decline (7.6%, not including dividends). However, more recent returns haven't been as impressive as that, with the stock returning just 14% in the last year , including dividends .
Since it's been a strong week for Tianjin Pharmaceutical Da Ren Tang Group shareholders, let's have a look at trend of the longer term fundamentals.
Check out our latest analysis for Tianjin Pharmaceutical Da Ren Tang Group
To quote Buffett, 'Ships will sail around the world but the Flat Earth Society will flourish. There will continue to be wide discrepancies between price and value in the marketplace...' One flawed but reasonable way to assess how sentiment around a company has changed is to compare the earnings per share (EPS) with the share price.
During three years of share price growth, Tianjin Pharmaceutical Da Ren Tang Group achieved compound earnings per share growth of 11% per year. We don't think it is entirely coincidental that the EPS growth is reasonably close to the 13% average annual increase in the share price. This suggests that sentiment and expectations have not changed drastically. Quite to the contrary, the share price has arguably reflected the EPS growth.
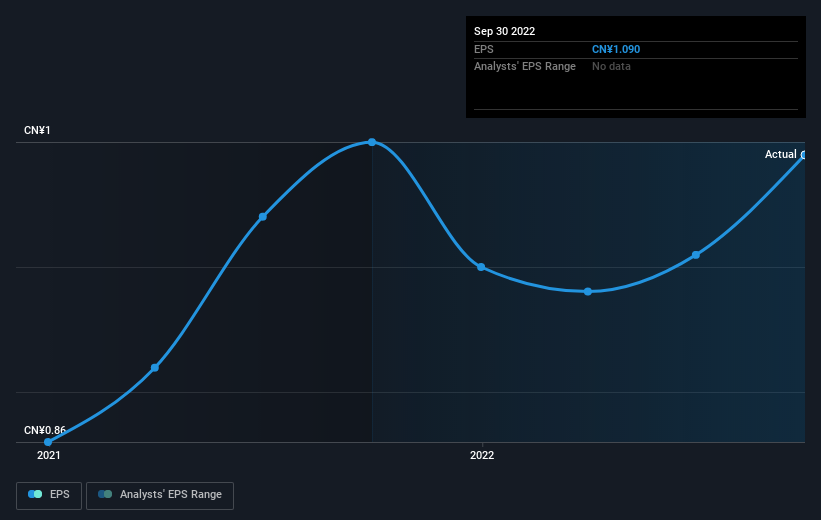
The company's earnings per share (over time) is depicted in the image below (click to see the exact numbers).
Dive deeper into Tianjin Pharmaceutical Da Ren Tang Group's key metrics by checking this interactive graph of Tianjin Pharmaceutical Da Ren Tang Group's earnings, revenue and cash flow.
What About Dividends?
It is important to consider the total shareholder return, as well as the share price return, for any given stock. Whereas the share price return only reflects the change in the share price, the TSR includes the value of dividends (assuming they were reinvested) and the benefit of any discounted capital raising or spin-off. Arguably, the TSR gives a more comprehensive picture of the return generated by a stock. We note that for Tianjin Pharmaceutical Da Ren Tang Group the TSR over the last 3 years was 71%, which is better than the share price return mentioned above. The dividends paid by the company have thusly boosted the total shareholder return.
A Different Perspective
It's nice to see that Tianjin Pharmaceutical Da Ren Tang Group shareholders have received a total shareholder return of 14% over the last year. Of course, that includes the dividend. That gain is better than the annual TSR over five years, which is 9%. Therefore it seems like sentiment around the company has been positive lately. Someone with an optimistic perspective could view the recent improvement in TSR as indicating that the business itself is getting better with time. It's always interesting to track share price performance over the longer term. But to understand Tianjin Pharmaceutical Da Ren Tang Group better, we need to consider many other factors. To that end, you should be aware of the 1 warning sign we've spotted with Tianjin Pharmaceutical Da Ren Tang Group .
If you like to buy stocks alongside management, then you might just love this free list of companies. (Hint: insiders have been buying them).
Please note, the market returns quoted in this article reflect the market weighted average returns of stocks that currently trade on SG exchanges.
Have feedback on this article? Concerned about the content? Get in touch with us directly. Alternatively, email editorial-team (at) simplywallst.com.
This article by Simply Wall St is general in nature. We provide commentary based on historical data and analyst forecasts only using an unbiased methodology and our articles are not intended to be financial advice. It does not constitute a recommendation to buy or sell any stock, and does not take account of your objectives, or your financial situation. We aim to bring you long-term focused analysis driven by fundamental data. Note that our analysis may not factor in the latest price-sensitive company announcements or qualitative material. Simply Wall St has no position in any stocks mentioned.