
 Yahoo Finance
 Williams-Sonoma (NYSE:WSM) stock performs better than its underlying earnings growth over last five years
The most you can lose on any stock (assuming you don't use leverage) is 100% of your money. But when you pick a company that is really flourishing, you can make more than 100%. For instance, the price of Williams-Sonoma, Inc. (NYSE:WSM) stock is up an impressive 161% over the last five years. It's also up 17% in about a month. But the price may well have benefitted from a buoyant market, since stocks have gained 7.5% in the last thirty days.
Since it's been a strong week for Williams-Sonoma shareholders, let's have a look at trend of the longer term fundamentals.
View our latest analysis for Williams-Sonoma
There is no denying that markets are sometimes efficient, but prices do not always reflect underlying business performance. One imperfect but simple way to consider how the market perception of a company has shifted is to compare the change in the earnings per share (EPS) with the share price movement.
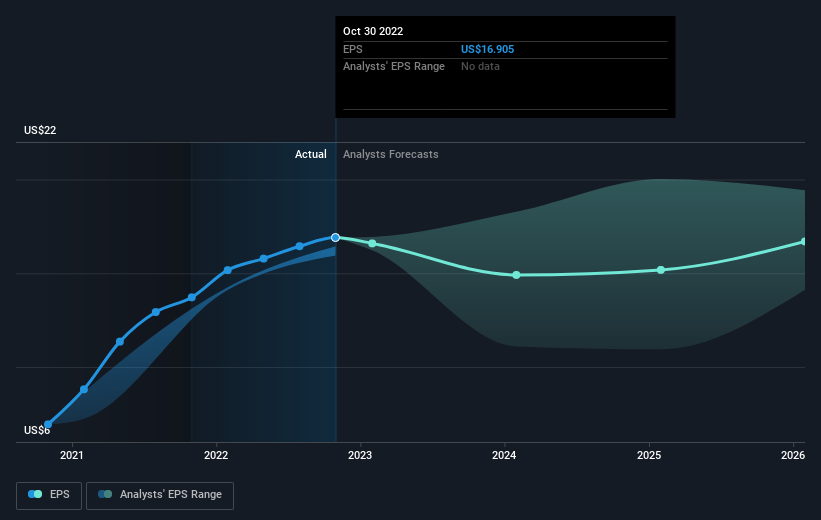
Over half a decade, Williams-Sonoma managed to grow its earnings per share at 38% a year. This EPS growth is higher than the 21% average annual increase in the share price. So one could conclude that the broader market has become more cautious towards the stock. The reasonably low P/E ratio of 7.64 also suggests market apprehension.
The image below shows how EPS has tracked over time (if you click on the image you can see greater detail).
It is of course excellent to see how Williams-Sonoma has grown profits over the years, but the future is more important for shareholders. If you are thinking of buying or selling Williams-Sonoma stock, you should check out this FREE detailed report on its balance sheet.
What About Dividends?
When looking at investment returns, it is important to consider the difference between total shareholder return (TSR) and share price return. The TSR incorporates the value of any spin-offs or discounted capital raisings, along with any dividends, based on the assumption that the dividends are reinvested. Arguably, the TSR gives a more comprehensive picture of the return generated by a stock. We note that for Williams-Sonoma the TSR over the last 5 years was 195%, which is better than the share price return mentioned above. This is largely a result of its dividend payments!
A Different Perspective
We regret to report that Williams-Sonoma shareholders are down 16% for the year (even including dividends). Unfortunately, that's worse than the broader market decline of 11%. However, it could simply be that the share price has been impacted by broader market jitters. It might be worth keeping an eye on the fundamentals, in case there's a good opportunity. On the bright side, long term shareholders have made money, with a gain of 24% per year over half a decade. If the fundamental data continues to indicate long term sustainable growth, the current sell-off could be an opportunity worth considering. I find it very interesting to look at share price over the long term as a proxy for business performance. But to truly gain insight, we need to consider other information, too. To that end, you should learn about the 3 warning signs we've spotted with Williams-Sonoma (including 2 which don't sit too well with us) .
If you like to buy stocks alongside management, then you might just love this free list of companies. (Hint: insiders have been buying them).
Please note, the market returns quoted in this article reflect the market weighted average returns of stocks that currently trade on US exchanges.
Have feedback on this article? Concerned about the content? Get in touch with us directly. Alternatively, email editorial-team (at) simplywallst.com.
This article by Simply Wall St is general in nature. We provide commentary based on historical data and analyst forecasts only using an unbiased methodology and our articles are not intended to be financial advice. It does not constitute a recommendation to buy or sell any stock, and does not take account of your objectives, or your financial situation. We aim to bring you long-term focused analysis driven by fundamental data. Note that our analysis may not factor in the latest price-sensitive company announcements or qualitative material. Simply Wall St has no position in any stocks mentioned.
Join A Paid User Research Session
You’ll receive a US$30 Amazon Gift card for 1 hour of your time while helping us build better investing tools for the individual investors like yourself. Sign up here
