
If you're looking for a multi-bagger, there's a few things to keep an eye out for. Typically, we'll want to notice a trend of growing return on capital employed (ROCE) and alongside that, an expanding base of capital employed. This shows us that it's a compounding machine, able to continually reinvest its earnings back into the business and generate higher returns. However, after investigating Weifu High-Technology Group (SZSE:200581), we don't think it's current trends fit the mold of a multi-bagger.
Return On Capital Employed (ROCE): What Is It?
Just to clarify if you're unsure, ROCE is a metric for evaluating how much pre-tax income (in percentage terms) a company earns on the capital invested in its business. The formula for this calculation on Weifu High-Technology Group is:
Return on Capital Employed = Earnings Before Interest and Tax (EBIT) ÷ (Total Assets - Current Liabilities)
0.026 = CN¥533m ÷ (CN¥32b - CN¥11b) (Based on the trailing twelve months to September 2022).
Thus, Weifu High-Technology Group has an ROCE of 2.6%. In absolute terms, that's a low return and it also under-performs the Auto Components industry average of 5.0%.
See our latest analysis for Weifu High-Technology Group
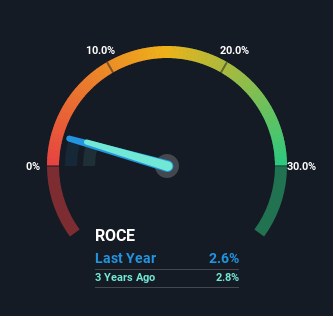
In the above chart we have measured Weifu High-Technology Group's prior ROCE against its prior performance, but the future is arguably more important. If you'd like to see what analysts are forecasting going forward, you should check out our free report for Weifu High-Technology Group.
So How Is Weifu High-Technology Group's ROCE Trending?
On the surface, the trend of ROCE at Weifu High-Technology Group doesn't inspire confidence. Over the last five years, returns on capital have decreased to 2.6% from 4.5% five years ago. Given the business is employing more capital while revenue has slipped, this is a bit concerning. This could mean that the business is losing its competitive advantage or market share, because while more money is being put into ventures, it's actually producing a lower return - "less bang for their buck" per se.
While on the subject, we noticed that the ratio of current liabilities to total assets has risen to 35%, which has impacted the ROCE. Without this increase, it's likely that ROCE would be even lower than 2.6%. While the ratio isn't currently too high, it's worth keeping an eye on this because if it gets particularly high, the business could then face some new elements of risk.
The Key Takeaway
From the above analysis, we find it rather worrisome that returns on capital and sales for Weifu High-Technology Group have fallen, meanwhile the business is employing more capital than it was five years ago. Investors must expect better things on the horizon though because the stock has risen 38% in the last five years. Either way, we aren't huge fans of the current trends and so with that we think you might find better investments elsewhere.
One final note, you should learn about the 2 warning signs we've spotted with Weifu High-Technology Group (including 1 which makes us a bit uncomfortable) .
For those who like to invest in solid companies, check out this free list of companies with solid balance sheets and high returns on equity.
Have feedback on this article? Concerned about the content? Get in touch with us directly. Alternatively, email editorial-team (at) simplywallst.com.
This article by Simply Wall St is general in nature. We provide commentary based on historical data and analyst forecasts only using an unbiased methodology and our articles are not intended to be financial advice. It does not constitute a recommendation to buy or sell any stock, and does not take account of your objectives, or your financial situation. We aim to bring you long-term focused analysis driven by fundamental data. Note that our analysis may not factor in the latest price-sensitive company announcements or qualitative material. Simply Wall St has no position in any stocks mentioned.