
Most readers would already be aware that Yunkang Group's (HKG:2325) stock increased significantly by 16% over the past three months. Given that the market rewards strong financials in the long-term, we wonder if that is the case in this instance. In this article, we decided to focus on Yunkang Group's ROE.
Return on equity or ROE is a key measure used to assess how efficiently a company's management is utilizing the company's capital. In short, ROE shows the profit each dollar generates with respect to its shareholder investments.
See our latest analysis for Yunkang Group
How Do You Calculate Return On Equity?
The formula for return on equity is:
Return on Equity = Net Profit (from continuing operations) ÷ Shareholders' Equity
So, based on the above formula, the ROE for Yunkang Group is:
19% = CN¥459m ÷ CN¥2.5b (Based on the trailing twelve months to June 2022).
The 'return' is the income the business earned over the last year. That means that for every HK$1 worth of shareholders' equity, the company generated HK$0.19 in profit.
Why Is ROE Important For Earnings Growth?
We have already established that ROE serves as an efficient profit-generating gauge for a company's future earnings. We now need to evaluate how much profit the company reinvests or "retains" for future growth which then gives us an idea about the growth potential of the company. Generally speaking, other things being equal, firms with a high return on equity and profit retention, have a higher growth rate than firms that don't share these attributes.
A Side By Side comparison of Yunkang Group's Earnings Growth And 19% ROE
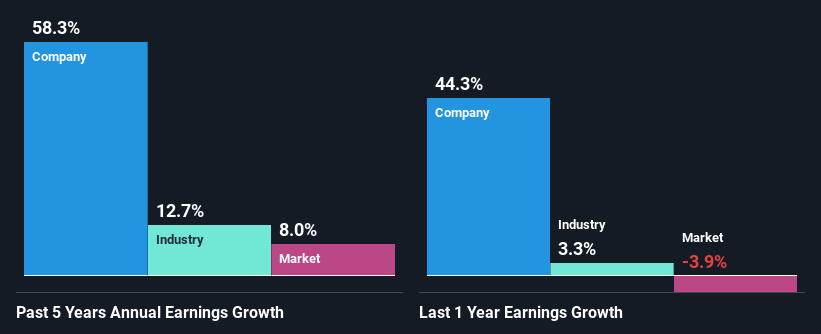
To begin with, Yunkang Group seems to have a respectable ROE. On comparing with the average industry ROE of 8.3% the company's ROE looks pretty remarkable. This probably laid the ground for Yunkang Group's significant 58% net income growth seen over the past five years. However, there could also be other causes behind this growth. Such as - high earnings retention or an efficient management in place.
Next, on comparing with the industry net income growth, we found that Yunkang Group's growth is quite high when compared to the industry average growth of 13% in the same period, which is great to see.
The basis for attaching value to a company is, to a great extent, tied to its earnings growth. It's important for an investor to know whether the market has priced in the company's expected earnings growth (or decline). This then helps them determine if the stock is placed for a bright or bleak future. Is Yunkang Group fairly valued compared to other companies? These 3 valuation measures might help you decide.
Is Yunkang Group Making Efficient Use Of Its Profits?
Yunkang Group's ' three-year median payout ratio is on the lower side at 6.5% implying that it is retaining a higher percentage (94%) of its profits. So it seems like the management is reinvesting profits heavily to grow its business and this reflects in its earnings growth number.
Conclusion
Overall, we are quite pleased with Yunkang Group's performance. Specifically, we like that the company is reinvesting a huge chunk of its profits at a high rate of return. This of course has caused the company to see substantial growth in its earnings. That being so, a study of the latest analyst forecasts show that the company is expected to see a slowdown in its future earnings growth. To know more about the company's future earnings growth forecasts take a look at this free report on analyst forecasts for the company to find out more.
Have feedback on this article? Concerned about the content? Get in touch with us directly. Alternatively, email editorial-team (at) simplywallst.com.
This article by Simply Wall St is general in nature. We provide commentary based on historical data and analyst forecasts only using an unbiased methodology and our articles are not intended to be financial advice. It does not constitute a recommendation to buy or sell any stock, and does not take account of your objectives, or your financial situation. We aim to bring you long-term focused analysis driven by fundamental data. Note that our analysis may not factor in the latest price-sensitive company announcements or qualitative material. Simply Wall St has no position in any stocks mentioned.