
This week we saw the Satellogic Inc. (NASDAQ:SATL) share price climb by 17%. But that isn't much consolation to those who have suffered through the declines of the last year. During that time the share price has sank like a stone, descending 58%. It's not that amazing to see a bounce after a drop like that. Arguably, the fall was overdone.
The recent uptick of 17% could be a positive sign of things to come, so let's take a look at historical fundamentals.
Check out our latest analysis for Satellogic
Given that Satellogic didn't make a profit in the last twelve months, we'll focus on revenue growth to form a quick view of its business development. When a company doesn't make profits, we'd generally expect to see good revenue growth. Some companies are willing to postpone profitability to grow revenue faster, but in that case one does expect good top-line growth.
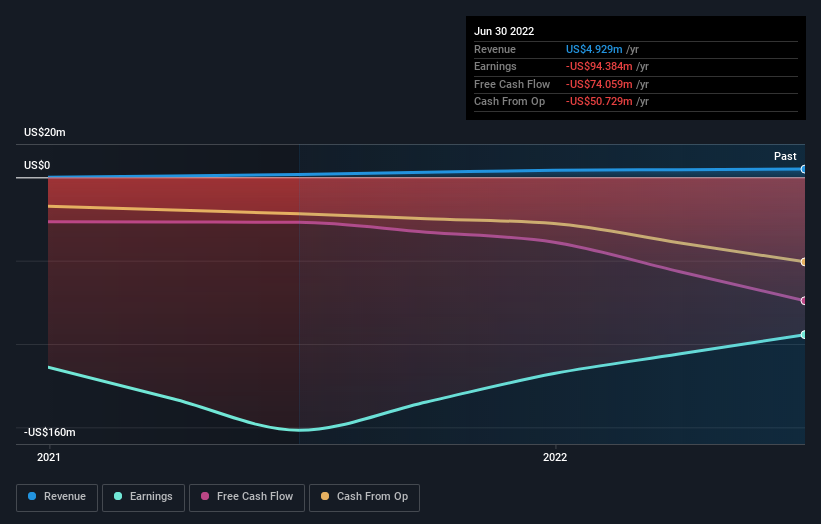
In the last twelve months, Satellogic increased its revenue by 189%. That's well above most other pre-profit companies. Meanwhile, the share price slid 58%. This could mean hype has come out of the stock because the bottom line is concerning investors. We'd definitely consider it a positive if the company is trending towards profitability. If you can see that happening, then perhaps consider adding this stock to your watchlist.
You can see how earnings and revenue have changed over time in the image below (click on the chart to see the exact values).
Take a more thorough look at Satellogic's financial health with this free report on its balance sheet.
A Different Perspective
Satellogic shareholders are down 58% for the year, even worse than the market loss of 16%. That's disappointing, but it's worth keeping in mind that the market-wide selling wouldn't have helped. The share price decline has continued throughout the most recent three months, down 17%, suggesting an absence of enthusiasm from investors. Basically, most investors should be wary of buying into a poor-performing stock, unless the business itself has clearly improved. I find it very interesting to look at share price over the long term as a proxy for business performance. But to truly gain insight, we need to consider other information, too. To that end, you should be aware of the 2 warning signs we've spotted with Satellogic .
If you would prefer to check out another company -- one with potentially superior financials -- then do not miss this free list of companies that have proven they can grow earnings.
Please note, the market returns quoted in this article reflect the market weighted average returns of stocks that currently trade on US exchanges.
Have feedback on this article? Concerned about the content? Get in touch with us directly. Alternatively, email editorial-team (at) simplywallst.com.
This article by Simply Wall St is general in nature. We provide commentary based on historical data and analyst forecasts only using an unbiased methodology and our articles are not intended to be financial advice. It does not constitute a recommendation to buy or sell any stock, and does not take account of your objectives, or your financial situation. We aim to bring you long-term focused analysis driven by fundamental data. Note that our analysis may not factor in the latest price-sensitive company announcements or qualitative material. Simply Wall St has no position in any stocks mentioned.