
 Yahoo Finance
 The past year for WalkMe (NASDAQ:WKME) investors has not been profitable
WalkMe Ltd. (NASDAQ:WKME) shareholders should be happy to see the share price up 20% in the last month. But that doesn't change the fact that the returns over the last year have been less than pleasing. The cold reality is that the stock has dropped 48% in one year, under-performing the market.
With that in mind, it's worth seeing if the company's underlying fundamentals have been the driver of long term performance, or if there are some discrepancies.
View our latest analysis for WalkMe
Because WalkMe made a loss in the last twelve months, we think the market is probably more focussed on revenue and revenue growth, at least for now. When a company doesn't make profits, we'd generally expect to see good revenue growth. Some companies are willing to postpone profitability to grow revenue faster, but in that case one does expect good top-line growth.
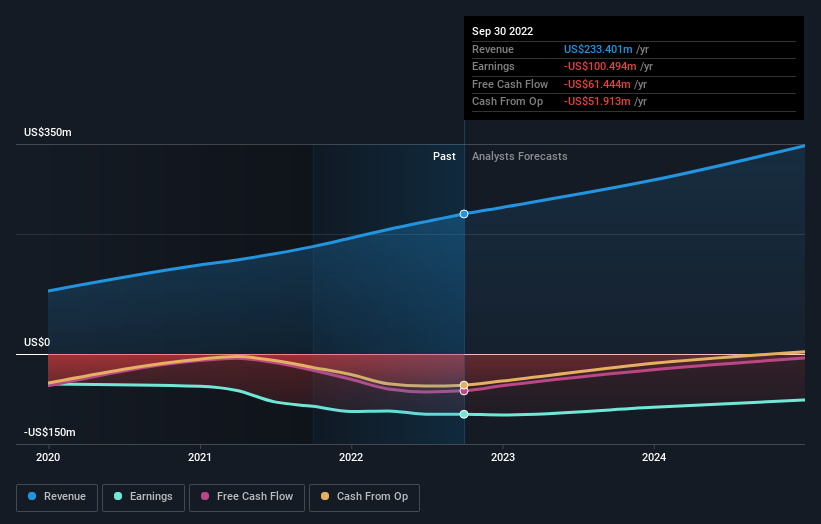
In the last twelve months, WalkMe increased its revenue by 30%. We think that is pretty nice growth. Meanwhile, the share price is down 48% over twelve months, which is disappointing given the progress made. This implies the market was expecting better growth. But if revenue keeps growing, then at a certain point the share price would likely follow.
You can see how earnings and revenue have changed over time in the image below (click on the chart to see the exact values).
You can see how its balance sheet has strengthened (or weakened) over time in this free interactive graphic.
A Different Perspective
We doubt WalkMe shareholders are happy with the loss of 48% over twelve months. That falls short of the market, which lost 23%. There's no doubt that's a disappointment, but the stock may well have fared better in a stronger market. It's great to see a nice little 16% rebound in the last three months. Let's just hope this isn't the widely-feared 'dead cat bounce' (which would indicate further declines to come). I find it very interesting to look at share price over the long term as a proxy for business performance. But to truly gain insight, we need to consider other information, too. Consider for instance, the ever-present spectre of investment risk. We've identified 1 warning sign with WalkMe , and understanding them should be part of your investment process.
We will like WalkMe better if we see some big insider buys. While we wait, check out this free list of growing companies with considerable, recent, insider buying.
Please note, the market returns quoted in this article reflect the market weighted average returns of stocks that currently trade on US exchanges.
Have feedback on this article? Concerned about the content? Get in touch with us directly. Alternatively, email editorial-team (at) simplywallst.com.
This article by Simply Wall St is general in nature. We provide commentary based on historical data and analyst forecasts only using an unbiased methodology and our articles are not intended to be financial advice. It does not constitute a recommendation to buy or sell any stock, and does not take account of your objectives, or your financial situation. We aim to bring you long-term focused analysis driven by fundamental data. Note that our analysis may not factor in the latest price-sensitive company announcements or qualitative material. Simply Wall St has no position in any stocks mentioned.
Join A Paid User Research Session
You’ll receive a US$30 Amazon Gift card for 1 hour of your time while helping us build better investing tools for the individual investors like yourself. Sign up here
