
China Yongda Automobiles Services Holdings Limited (HKG:3669) shareholders will doubtless be very grateful to see the share price up 33% in the last month. But that doesn't change the fact that the returns over the last year have been less than pleasing. After all, the share price is down 50% in the last year, significantly under-performing the market.
On a more encouraging note the company has added CN¥637m to its market cap in just the last 7 days, so let's see if we can determine what's driven the one-year loss for shareholders.
View our latest analysis for China Yongda Automobiles Services Holdings
To quote Buffett, 'Ships will sail around the world but the Flat Earth Society will flourish. There will continue to be wide discrepancies between price and value in the marketplace...' One way to examine how market sentiment has changed over time is to look at the interaction between a company's share price and its earnings per share (EPS).
Unfortunately China Yongda Automobiles Services Holdings reported an EPS drop of 10% for the last year. The share price decline of 50% is actually more than the EPS drop. This suggests the EPS fall has made some shareholders are more nervous about the business. The less favorable sentiment is reflected in its current P/E ratio of 5.06.
The company's earnings per share (over time) is depicted in the image below (click to see the exact numbers).
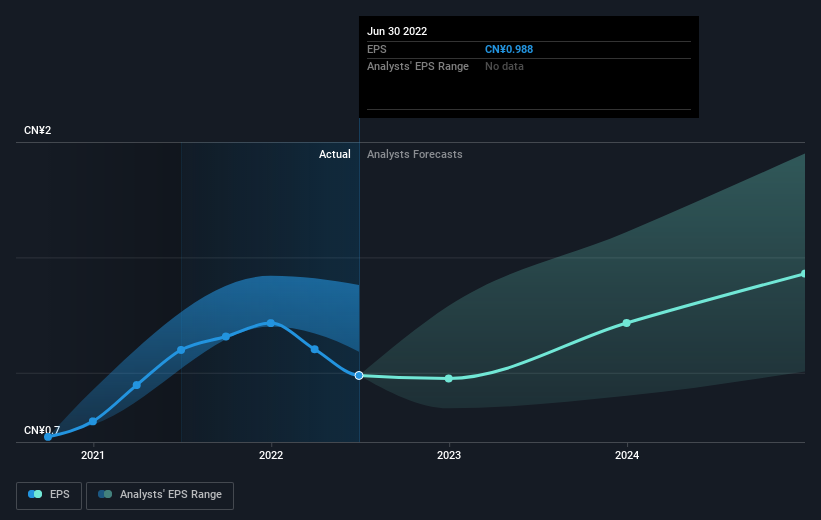 SEHK:3669 Earnings Per Share Growth December 14th 2022
We consider it positive that insiders have made significant purchases in the last year. Even so, future earnings will be far more important to whether current shareholders make money. Before buying or selling a stock, we always recommend a close examination of historic growth trends, available here..
What About Dividends?
When looking at investment returns, it is important to consider the difference between total shareholder return (TSR) and share price return. Whereas the share price return only reflects the change in the share price, the TSR includes the value of dividends (assuming they were reinvested) and the benefit of any discounted capital raising or spin-off. Arguably, the TSR gives a more comprehensive picture of the return generated by a stock. We note that for China Yongda Automobiles Services Holdings the TSR over the last 1 year was -46%, which is better than the share price return mentioned above. And there's no prize for guessing that the dividend payments largely explain the divergence!
A Different Perspective
While the broader market lost about 14% in the twelve months, China Yongda Automobiles Services Holdings shareholders did even worse, losing 46% (even including dividends). Having said that, it's inevitable that some stocks will be oversold in a falling market. The key is to keep your eyes on the fundamental developments. Unfortunately, last year's performance may indicate unresolved challenges, given that it was worse than the annualised loss of 3% over the last half decade. Generally speaking long term share price weakness can be a bad sign, though contrarian investors might want to research the stock in hope of a turnaround. It's always interesting to track share price performance over the longer term. But to understand China Yongda Automobiles Services Holdings better, we need to consider many other factors. For instance, we've identified 1 warning sign for China Yongda Automobiles Services Holdings that you should be aware of.
If you like to buy stocks alongside management, then you might just love this free list of companies. (Hint: insiders have been buying them).
Please note, the market returns quoted in this article reflect the market weighted average returns of stocks that currently trade on HK exchanges.
Have feedback on this article? Concerned about the content? Get in touch with us directly. Alternatively, email editorial-team (at) simplywallst.com.
This article by Simply Wall St is general in nature. We provide commentary based on historical data and analyst forecasts only using an unbiased methodology and our articles are not intended to be financial advice. It does not constitute a recommendation to buy or sell any stock, and does not take account of your objectives, or your financial situation. We aim to bring you long-term focused analysis driven by fundamental data. Note that our analysis may not factor in the latest price-sensitive company announcements or qualitative material. Simply Wall St has no position in any stocks mentioned.