
It is doubtless a positive to see that the Tianli International Holdings Limited (HKG:1773) share price has gained some 52% in the last three months. But that doesn't help the fact that the three year return is less impressive. After all, the share price is down 38% in the last three years, significantly under-performing the market.
On a more encouraging note the company has added CN¥689m to its market cap in just the last 7 days, so let's see if we can determine what's driven the three-year loss for shareholders.
See our latest analysis for Tianli International Holdings
To paraphrase Benjamin Graham: Over the short term the market is a voting machine, but over the long term it's a weighing machine. One imperfect but simple way to consider how the market perception of a company has shifted is to compare the change in the earnings per share (EPS) with the share price movement.
During five years of share price growth, Tianli International Holdings moved from a loss to profitability. We would usually expect to see the share price rise as a result. So given the share price is down it's worth checking some other metrics too.
With a rather small yield of just 1.3% we doubt that the stock's share price is based on its dividend. We think that the revenue decline over three years, at a rate of 21% per year, probably had some shareholders looking to sell. After all, if revenue keeps shrinking, it may be difficult to find earnings growth in the future.
The image below shows how earnings and revenue have tracked over time (if you click on the image you can see greater detail).
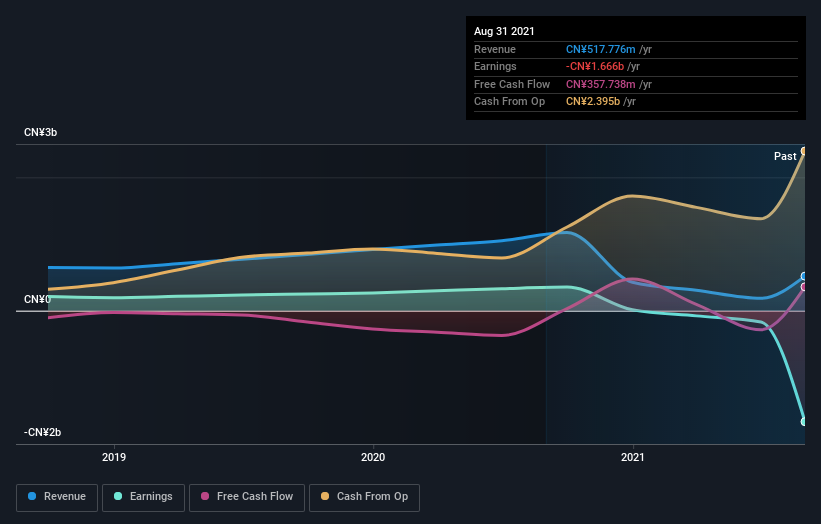 SEHK:1773 Earnings and Revenue Growth December 6th 2022
We like that insiders have been buying shares in the last twelve months. Having said that, most people consider earnings and revenue growth trends to be a more meaningful guide to the business. If you are thinking of buying or selling Tianli International Holdings stock, you should check out this free report showing analyst profit forecasts.
What About Dividends?
As well as measuring the share price return, investors should also consider the total shareholder return (TSR). The TSR incorporates the value of any spin-offs or discounted capital raisings, along with any dividends, based on the assumption that the dividends are reinvested. It's fair to say that the TSR gives a more complete picture for stocks that pay a dividend. In the case of Tianli International Holdings, it has a TSR of -35% for the last 3 years. That exceeds its share price return that we previously mentioned. This is largely a result of its dividend payments!
A Different Perspective
Pleasingly, Tianli International Holdings' total shareholder return last year was 2.6%. And yes, that does include the dividend. This recent result is much better than the 11% drop suffered by shareholders each year (on average) over the last three. The optimist would say this is evidence that the stock has bottomed, and better days lie ahead. While it is well worth considering the different impacts that market conditions can have on the share price, there are other factors that are even more important. For example, we've discovered 2 warning signs for Tianli International Holdings (1 is potentially serious!) that you should be aware of before investing here.
Tianli International Holdings is not the only stock insiders are buying. So take a peek at this free list of growing companies with insider buying.
Please note, the market returns quoted in this article reflect the market weighted average returns of stocks that currently trade on HK exchanges.
Have feedback on this article? Concerned about the content? Get in touch with us directly. Alternatively, email editorial-team (at) simplywallst.com.
This article by Simply Wall St is general in nature. We provide commentary based on historical data and analyst forecasts only using an unbiased methodology and our articles are not intended to be financial advice. It does not constitute a recommendation to buy or sell any stock, and does not take account of your objectives, or your financial situation. We aim to bring you long-term focused analysis driven by fundamental data. Note that our analysis may not factor in the latest price-sensitive company announcements or qualitative material. Simply Wall St has no position in any stocks mentioned.