
Some say volatility, rather than debt, is the best way to think about risk as an investor, but Warren Buffett famously said that 'Volatility is far from synonymous with risk.' So it seems the smart money knows that debt - which is usually involved in bankruptcies - is a very important factor, when you assess how risky a company is. As with many other companies Nordson Corporation (NASDAQ:NDSN) makes use of debt. But the real question is whether this debt is making the company risky.
When Is Debt A Problem?
Generally speaking, debt only becomes a real problem when a company can't easily pay it off, either by raising capital or with its own cash flow. In the worst case scenario, a company can go bankrupt if it cannot pay its creditors. However, a more usual (but still expensive) situation is where a company must dilute shareholders at a cheap share price simply to get debt under control. By replacing dilution, though, debt can be an extremely good tool for businesses that need capital to invest in growth at high rates of return. When we examine debt levels, we first consider both cash and debt levels, together.
See our latest analysis for Nordson
How Much Debt Does Nordson Carry?
As you can see below, Nordson had US$803.4m of debt, at July 2022, which is about the same as the year before. You can click the chart for greater detail. However, it does have US$128.7m in cash offsetting this, leading to net debt of about US$674.7m.
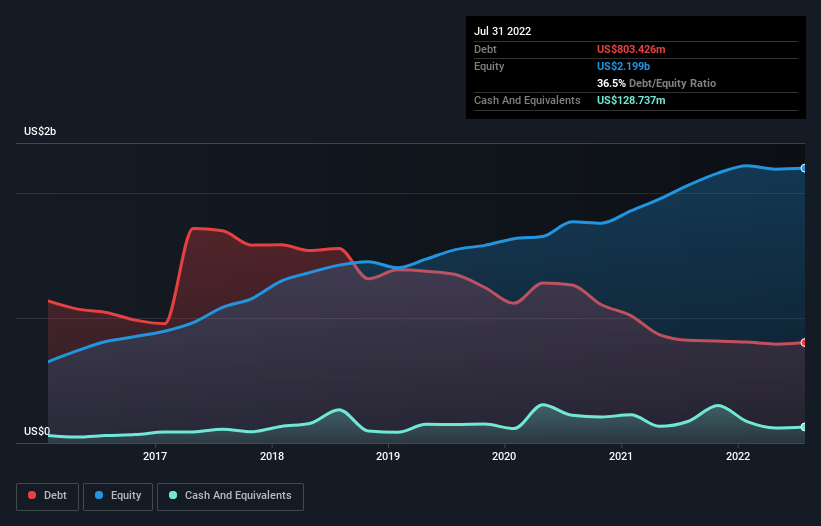 NasdaqGS:NDSN Debt to Equity History November 18th 2022
How Healthy Is Nordson's Balance Sheet?
The latest balance sheet data shows that Nordson had liabilities of US$827.3m due within a year, and liabilities of US$797.5m falling due after that. Offsetting these obligations, it had cash of US$128.7m as well as receivables valued at US$530.8m due within 12 months. So its liabilities total US$965.3m more than the combination of its cash and short-term receivables.
Given Nordson has a humongous market capitalization of US$13.1b, it's hard to believe these liabilities pose much threat. However, we do think it is worth keeping an eye on its balance sheet strength, as it may change over time.
We use two main ratios to inform us about debt levels relative to earnings. The first is net debt divided by earnings before interest, tax, depreciation, and amortization (EBITDA), while the second is how many times its earnings before interest and tax (EBIT) covers its interest expense (or its interest cover, for short). Thus we consider debt relative to earnings both with and without depreciation and amortization expenses.
Nordson's net debt is only 0.92 times its EBITDA. And its EBIT covers its interest expense a whopping 32.2 times over. So we're pretty relaxed about its super-conservative use of debt. Fortunately, Nordson grew its EBIT by 9.2% in the last year, making that debt load look even more manageable. The balance sheet is clearly the area to focus on when you are analysing debt. But it is future earnings, more than anything, that will determine Nordson's ability to maintain a healthy balance sheet going forward. So if you're focused on the future you can check out this free report showing analyst profit forecasts.
Finally, while the tax-man may adore accounting profits, lenders only accept cold hard cash. So it's worth checking how much of that EBIT is backed by free cash flow. Over the last three years, Nordson recorded free cash flow worth a fulsome 84% of its EBIT, which is stronger than we'd usually expect. That positions it well to pay down debt if desirable to do so.
Our View
The good news is that Nordson's demonstrated ability to cover its interest expense with its EBIT delights us like a fluffy puppy does a toddler. And the good news does not stop there, as its conversion of EBIT to free cash flow also supports that impression! Zooming out, Nordson seems to use debt quite reasonably; and that gets the nod from us. While debt does bring risk, when used wisely it can also bring a higher return on equity. Above most other metrics, we think its important to track how fast earnings per share is growing, if at all. If you've also come to that realization, you're in luck, because today you can view this interactive graph of Nordson's earnings per share history for free.
If you're interested in investing in businesses that can grow profits without the burden of debt, then check out this free list of growing businesses that have net cash on the balance sheet.
Have feedback on this article? Concerned about the content? Get in touch with us directly. Alternatively, email editorial-team (at) simplywallst.com.
This article by Simply Wall St is general in nature. We provide commentary based on historical data and analyst forecasts only using an unbiased methodology and our articles are not intended to be financial advice. It does not constitute a recommendation to buy or sell any stock, and does not take account of your objectives, or your financial situation. We aim to bring you long-term focused analysis driven by fundamental data. Note that our analysis may not factor in the latest price-sensitive company announcements or qualitative material. Simply Wall St has no position in any stocks mentioned.