
Many investors are still learning about the various metrics that can be useful when analysing a stock. This article is for those who would like to learn about Return On Equity (ROE). By way of learning-by-doing, we'll look at ROE to gain a better understanding of Trinity Industries, Inc. (NYSE:TRN).
ROE or return on equity is a useful tool to assess how effectively a company can generate returns on the investment it received from its shareholders. Put another way, it reveals the company's success at turning shareholder investments into profits.
See our latest analysis for Trinity Industries
How Is ROE Calculated?
The formula for ROE is:
Return on Equity = Net Profit (from continuing operations) ÷ Shareholders' Equity
So, based on the above formula, the ROE for Trinity Industries is:
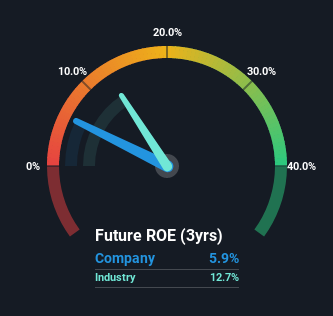
5.9% = US$74m ÷ US$1.3b (Based on the trailing twelve months to June 2022).
The 'return' is the income the business earned over the last year. One way to conceptualize this is that for each $1 of shareholders' capital it has, the company made $0.06 in profit.
Does Trinity Industries Have A Good ROE?
By comparing a company's ROE with its industry average, we can get a quick measure of how good it is. The limitation of this approach is that some companies are quite different from others, even within the same industry classification. As shown in the graphic below, Trinity Industries has a lower ROE than the average (13%) in the Machinery industry classification.
 NYSE:TRN Return on Equity October 3rd 2022
Unfortunately, that's sub-optimal. That being said, a low ROE is not always a bad thing, especially if the company has low leverage as this still leaves room for improvement if the company were to take on more debt. A high debt company having a low ROE is a different story altogether and a risky investment in our books. You can see the 3 risks we have identified for Trinity Industries by visiting our risks dashboard for free on our platform here.
Why You Should Consider Debt When Looking At ROE
Virtually all companies need money to invest in the business, to grow profits. That cash can come from retained earnings, issuing new shares (equity), or debt. In the first and second cases, the ROE will reflect this use of cash for investment in the business. In the latter case, the debt required for growth will boost returns, but will not impact the shareholders' equity. Thus the use of debt can improve ROE, albeit along with extra risk in the case of stormy weather, metaphorically speaking.
Combining Trinity Industries' Debt And Its 5.9% Return On Equity
It appears that Trinity Industries makes extensive use of debt to improve its returns, because it has an alarmingly high debt to equity ratio of 4.41. Most investors would need a low share price to be interested in a company with low ROE and high debt to equity.
Conclusion
Return on equity is useful for comparing the quality of different businesses. Companies that can achieve high returns on equity without too much debt are generally of good quality. All else being equal, a higher ROE is better.
But ROE is just one piece of a bigger puzzle, since high quality businesses often trade on high multiples of earnings. It is important to consider other factors, such as future profit growth -- and how much investment is required going forward. So I think it may be worth checking this free report on analyst forecasts for the company.
Of course, you might find a fantastic investment by looking elsewhere. So take a peek at this free list of interesting companies.
Have feedback on this article? Concerned about the content? Get in touch with us directly. Alternatively, email editorial-team (at) simplywallst.com.
This article by Simply Wall St is general in nature. We provide commentary based on historical data and analyst forecasts only using an unbiased methodology and our articles are not intended to be financial advice. It does not constitute a recommendation to buy or sell any stock, and does not take account of your objectives, or your financial situation. We aim to bring you long-term focused analysis driven by fundamental data. Note that our analysis may not factor in the latest price-sensitive company announcements or qualitative material. Simply Wall St has no position in any stocks mentioned.