
Statistically speaking, long term investing is a profitable endeavour. But along the way some stocks are going to perform badly. For example, after five long years the Sa Sa International Holdings Limited (HKG:178) share price is a whole 64% lower. That's an unpleasant experience for long term holders. And we doubt long term believers are the only worried holders, since the stock price has declined 33% over the last twelve months. Furthermore, it's down 23% in about a quarter. That's not much fun for holders. However, one could argue that the price has been influenced by the general market, which is down 19% in the same timeframe.
If the past week is anything to go by, investor sentiment for Sa Sa International Holdings isn't positive, so let's see if there's a mismatch between fundamentals and the share price.
See our latest analysis for Sa Sa International Holdings
Sa Sa International Holdings wasn't profitable in the last twelve months, it is unlikely we'll see a strong correlation between its share price and its earnings per share (EPS). Arguably revenue is our next best option. Shareholders of unprofitable companies usually expect strong revenue growth. Some companies are willing to postpone profitability to grow revenue faster, but in that case one does expect good top-line growth.
Over half a decade Sa Sa International Holdings reduced its trailing twelve month revenue by 21% for each year. That's definitely a weaker result than most pre-profit companies report. It seems appropriate, then, that the share price slid about 10% annually during that time. We don't generally like to own companies that lose money and don't grow revenues. You might be better off spending your money on a leisure activity. This looks like a really risky stock to buy, at a glance.
The graphic below depicts how earnings and revenue have changed over time (unveil the exact values by clicking on the image).
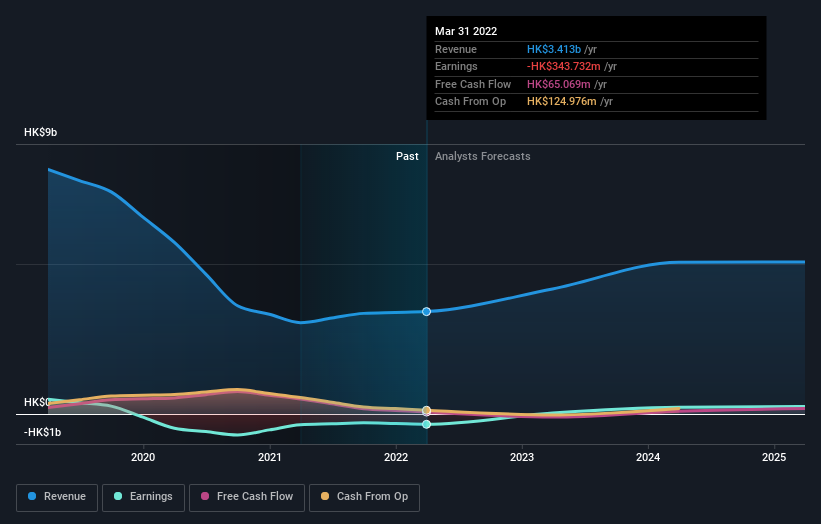 SEHK:178 Earnings and Revenue Growth September 28th 2022
We're pleased to report that the CEO is remunerated more modestly than most CEOs at similarly capitalized companies. It's always worth keeping an eye on CEO pay, but a more important question is whether the company will grow earnings throughout the years. You can see what analysts are predicting for Sa Sa International Holdings in this interactive graph of future profit estimates.
What About The Total Shareholder Return (TSR)?
We've already covered Sa Sa International Holdings' share price action, but we should also mention its total shareholder return (TSR). Arguably the TSR is a more complete return calculation because it accounts for the value of dividends (as if they were reinvested), along with the hypothetical value of any discounted capital that have been offered to shareholders. Its history of dividend payouts mean that Sa Sa International Holdings' TSR, which was a 59% drop over the last 5 years, was not as bad as the share price return.
A Different Perspective
While the broader market lost about 22% in the twelve months, Sa Sa International Holdings shareholders did even worse, losing 33%. Having said that, it's inevitable that some stocks will be oversold in a falling market. The key is to keep your eyes on the fundamental developments. Regrettably, last year's performance caps off a bad run, with the shareholders facing a total loss of 10% per year over five years. Generally speaking long term share price weakness can be a bad sign, though contrarian investors might want to research the stock in hope of a turnaround. You could get a better understanding of Sa Sa International Holdings' growth by checking out this more detailed historical graph of earnings, revenue and cash flow.
If you would prefer to check out another company -- one with potentially superior financials -- then do not miss this free list of companies that have proven they can grow earnings.
Please note, the market returns quoted in this article reflect the market weighted average returns of stocks that currently trade on HK exchanges.
Have feedback on this article? Concerned about the content? Get in touch with us directly. Alternatively, email editorial-team (at) simplywallst.com.
This article by Simply Wall St is general in nature. We provide commentary based on historical data and analyst forecasts only using an unbiased methodology and our articles are not intended to be financial advice. It does not constitute a recommendation to buy or sell any stock, and does not take account of your objectives, or your financial situation. We aim to bring you long-term focused analysis driven by fundamental data. Note that our analysis may not factor in the latest price-sensitive company announcements or qualitative material. Simply Wall St has no position in any stocks mentioned.