
These days it's easy to simply buy an index fund, and your returns should (roughly) match the market. In contrast individual stocks will provide a wide range of possible returns, and may fall short. One such example is Allied Group Limited (HKG:373), which saw its share price fall 28% over a year, against a market decline of 22%. On the other hand, the stock is actually up 2.0% over three years. Shareholders have had an even rougher run lately, with the share price down 16% in the last 90 days. But this could be related to the weak market, which is down 19% in the same period.
With the stock having lost 6.4% in the past week, it's worth taking a look at business performance and seeing if there's any red flags.
See our latest analysis for Allied Group
In his essay The Superinvestors of Graham-and-Doddsville Warren Buffett described how share prices do not always rationally reflect the value of a business. One imperfect but simple way to consider how the market perception of a company has shifted is to compare the change in the earnings per share (EPS) with the share price movement.
Unfortunately Allied Group reported an EPS drop of 4.3% for the last year. The share price decline of 28% is actually more than the EPS drop. So it seems the market was too confident about the business, a year ago. The P/E ratio of 1.84 also points to the negative market sentiment.
The company's earnings per share (over time) is depicted in the image below (click to see the exact numbers).
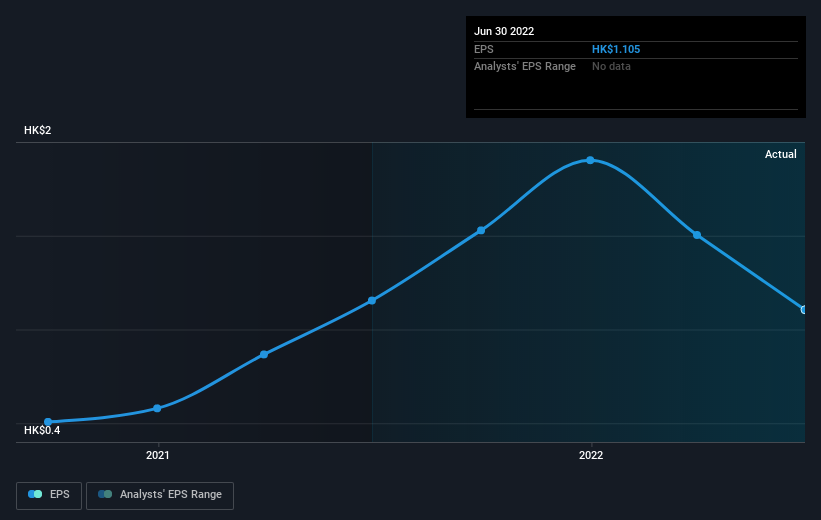 SEHK:373 Earnings Per Share Growth September 27th 2022
This free interactive report on Allied Group's earnings, revenue and cash flow is a great place to start, if you want to investigate the stock further.
What About Dividends?
It is important to consider the total shareholder return, as well as the share price return, for any given stock. Whereas the share price return only reflects the change in the share price, the TSR includes the value of dividends (assuming they were reinvested) and the benefit of any discounted capital raising or spin-off. Arguably, the TSR gives a more comprehensive picture of the return generated by a stock. We note that for Allied Group the TSR over the last 1 year was -24%, which is better than the share price return mentioned above. The dividends paid by the company have thusly boosted the total shareholder return.
A Different Perspective
The total return of 24% received by Allied Group shareholders over the last year isn't far from the market return of -22%. The silver lining is that longer term investors would have made a total return of 2% per year over half a decade. If the fundamental data remains strong, and the share price is simply down on sentiment, then this could be an opportunity worth investigating. It's always interesting to track share price performance over the longer term. But to understand Allied Group better, we need to consider many other factors. To that end, you should be aware of the 2 warning signs we've spotted with Allied Group .
We will like Allied Group better if we see some big insider buys. While we wait, check out this free list of growing companies with considerable, recent, insider buying.
Please note, the market returns quoted in this article reflect the market weighted average returns of stocks that currently trade on HK exchanges.
Have feedback on this article? Concerned about the content? Get in touch with us directly. Alternatively, email editorial-team (at) simplywallst.com.
This article by Simply Wall St is general in nature. We provide commentary based on historical data and analyst forecasts only using an unbiased methodology and our articles are not intended to be financial advice. It does not constitute a recommendation to buy or sell any stock, and does not take account of your objectives, or your financial situation. We aim to bring you long-term focused analysis driven by fundamental data. Note that our analysis may not factor in the latest price-sensitive company announcements or qualitative material. Simply Wall St has no position in any stocks mentioned.