
The SITC International Holdings Company Limited (HKG:1308) share price is down a rather concerning 34% in the last month. But that doesn't change the fact that shareholders have received really good returns over the last five years. It's fair to say most would be happy with 109% the gain in that time. So while it's never fun to see a share price fall, it's important to look at a longer time horizon. Of course, that doesn't necessarily mean it's cheap now. While the long term returns are impressive, we do have some sympathy for those who bought more recently, given the 50% drop, in the last year.
Since the long term performance has been good but there's been a recent pullback of 9.2%, let's check if the fundamentals match the share price.
Check out our latest analysis for SITC International Holdings
While the efficient markets hypothesis continues to be taught by some, it has been proven that markets are over-reactive dynamic systems, and investors are not always rational. One way to examine how market sentiment has changed over time is to look at the interaction between a company's share price and its earnings per share (EPS).
Over half a decade, SITC International Holdings managed to grow its earnings per share at 67% a year. This EPS growth is higher than the 16% average annual increase in the share price. So it seems the market isn't so enthusiastic about the stock these days. This cautious sentiment is reflected in its (fairly low) P/E ratio of 2.78.
You can see how EPS has changed over time in the image below (click on the chart to see the exact values).
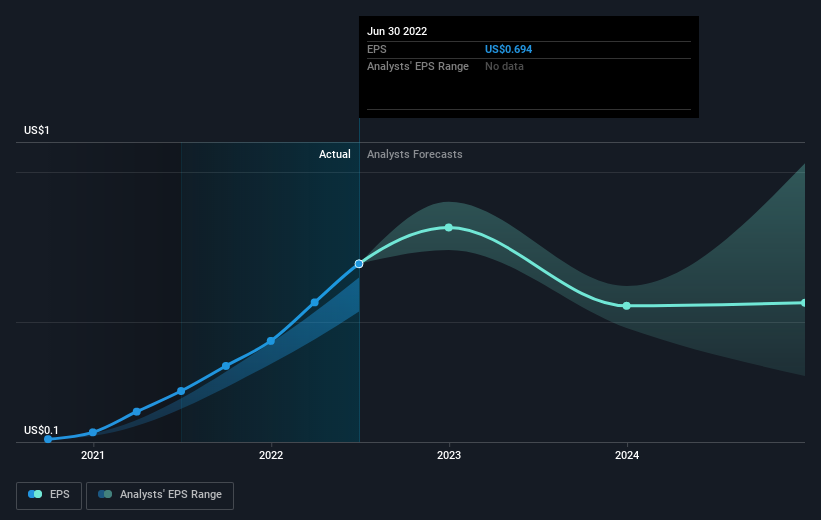 SEHK:1308 Earnings Per Share Growth September 27th 2022
We know that SITC International Holdings has improved its bottom line over the last three years, but what does the future have in store? Take a more thorough look at SITC International Holdings' financial health with this free report on its balance sheet.
What About Dividends?
When looking at investment returns, it is important to consider the difference between total shareholder return (TSR) and share price return. The TSR incorporates the value of any spin-offs or discounted capital raisings, along with any dividends, based on the assumption that the dividends are reinvested. Arguably, the TSR gives a more comprehensive picture of the return generated by a stock. In the case of SITC International Holdings, it has a TSR of 228% for the last 5 years. That exceeds its share price return that we previously mentioned. And there's no prize for guessing that the dividend payments largely explain the divergence!
A Different Perspective
We regret to report that SITC International Holdings shareholders are down 40% for the year (even including dividends). Unfortunately, that's worse than the broader market decline of 22%. However, it could simply be that the share price has been impacted by broader market jitters. It might be worth keeping an eye on the fundamentals, in case there's a good opportunity. Longer term investors wouldn't be so upset, since they would have made 27%, each year, over five years. If the fundamental data continues to indicate long term sustainable growth, the current sell-off could be an opportunity worth considering. I find it very interesting to look at share price over the long term as a proxy for business performance. But to truly gain insight, we need to consider other information, too. To that end, you should learn about the 3 warning signs we've spotted with SITC International Holdings (including 2 which are significant) .
But note: SITC International Holdings may not be the best stock to buy. So take a peek at this free list of interesting companies with past earnings growth (and further growth forecast).
Please note, the market returns quoted in this article reflect the market weighted average returns of stocks that currently trade on HK exchanges.
Have feedback on this article? Concerned about the content? Get in touch with us directly. Alternatively, email editorial-team (at) simplywallst.com.
This article by Simply Wall St is general in nature. We provide commentary based on historical data and analyst forecasts only using an unbiased methodology and our articles are not intended to be financial advice. It does not constitute a recommendation to buy or sell any stock, and does not take account of your objectives, or your financial situation. We aim to bring you long-term focused analysis driven by fundamental data. Note that our analysis may not factor in the latest price-sensitive company announcements or qualitative material. Simply Wall St has no position in any stocks mentioned.