
Passive investing in an index fund is a good way to ensure your own returns roughly match the overall market. While individual stocks can be big winners, plenty more fail to generate satisfactory returns. That downside risk was realized by First American Financial Corporation (NYSE:FAF) shareholders over the last year, as the share price declined 31%. That's disappointing when you consider the market declined 22%. At least the damage isn't so bad if you look at the last three years, since the stock is down 20% in that time. Unfortunately the share price momentum is still quite negative, with prices down 19% in thirty days. But this could be related to poor market conditions -- stocks are down 13% in the same time.
With the stock having lost 7.2% in the past week, it's worth taking a look at business performance and seeing if there's any red flags.
See our latest analysis for First American Financial
To quote Buffett, 'Ships will sail around the world but the Flat Earth Society will flourish. There will continue to be wide discrepancies between price and value in the marketplace...' One way to examine how market sentiment has changed over time is to look at the interaction between a company's share price and its earnings per share (EPS).
Unhappily, First American Financial had to report a 7.2% decline in EPS over the last year. This reduction in EPS is not as bad as the 31% share price fall. This suggests the EPS fall has made some shareholders are more nervous about the business. The P/E ratio of 5.36 also points to the negative market sentiment.
The graphic below depicts how EPS has changed over time (unveil the exact values by clicking on the image).
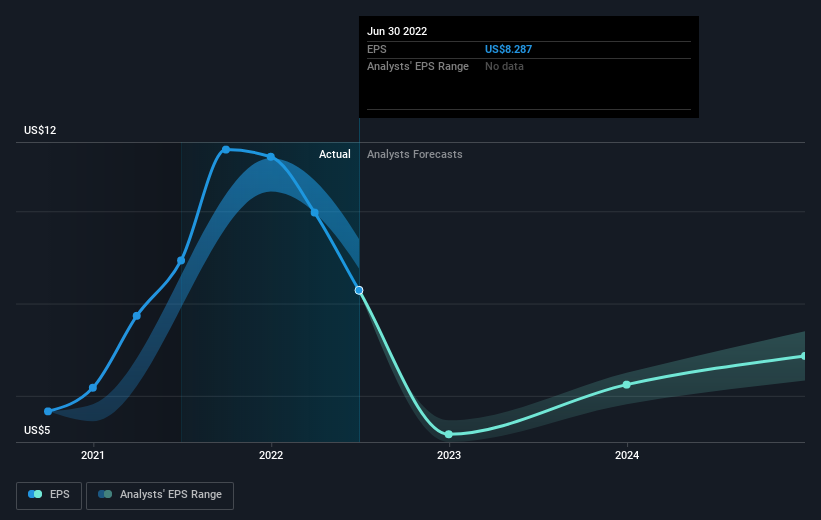 NYSE:FAF Earnings Per Share Growth September 25th 2022
Dive deeper into First American Financial's key metrics by checking this interactive graph of First American Financial's earnings, revenue and cash flow.
What About Dividends?
As well as measuring the share price return, investors should also consider the total shareholder return (TSR). The TSR is a return calculation that accounts for the value of cash dividends (assuming that any dividend received was reinvested) and the calculated value of any discounted capital raisings and spin-offs. Arguably, the TSR gives a more comprehensive picture of the return generated by a stock. In the case of First American Financial, it has a TSR of -28% for the last 1 year. That exceeds its share price return that we previously mentioned. And there's no prize for guessing that the dividend payments largely explain the divergence!
A Different Perspective
While the broader market lost about 22% in the twelve months, First American Financial shareholders did even worse, losing 28% (even including dividends). Having said that, it's inevitable that some stocks will be oversold in a falling market. The key is to keep your eyes on the fundamental developments. On the bright side, long term shareholders have made money, with a gain of 1.9% per year over half a decade. It could be that the recent sell-off is an opportunity, so it may be worth checking the fundamental data for signs of a long term growth trend. Before spending more time on First American Financial it might be wise to click here to see if insiders have been buying or selling shares.
If you would prefer to check out another company -- one with potentially superior financials -- then do not miss this free list of companies that have proven they can grow earnings.
Please note, the market returns quoted in this article reflect the market weighted average returns of stocks that currently trade on US exchanges.
Have feedback on this article? Concerned about the content? Get in touch with us directly. Alternatively, email editorial-team (at) simplywallst.com.
This article by Simply Wall St is general in nature. We provide commentary based on historical data and analyst forecasts only using an unbiased methodology and our articles are not intended to be financial advice. It does not constitute a recommendation to buy or sell any stock, and does not take account of your objectives, or your financial situation. We aim to bring you long-term focused analysis driven by fundamental data. Note that our analysis may not factor in the latest price-sensitive company announcements or qualitative material. Simply Wall St has no position in any stocks mentioned.