
By buying an index fund, investors can approximate the average market return. But if you pick the right individual stocks, you could make more than that. Just take a look at Wangfujing Group Co., Ltd. (SHSE:600859), which is up 61%, over three years, soundly beating the market return of 17% (not including dividends).
Now it's worth having a look at the company's fundamentals too, because that will help us determine if the long term shareholder return has matched the performance of the underlying business.
Check out our latest analysis for Wangfujing Group
To paraphrase Benjamin Graham: Over the short term the market is a voting machine, but over the long term it's a weighing machine. One way to examine how market sentiment has changed over time is to look at the interaction between a company's share price and its earnings per share (EPS).
Over the last three years, Wangfujing Group failed to grow earnings per share, which fell 12% (annualized).
Thus, it seems unlikely that the market is focussed on EPS growth at the moment. Since the change in EPS doesn't seem to correlate with the change in share price, it's worth taking a look at other metrics.
The modest 1.7% dividend yield is unlikely to be propping up the share price. You can only imagine how long term shareholders feel about the declining revenue trend (slipping at 31% per year). What's clear is that historic earnings and revenue aren't matching up with the share price action, very well. So you might have to dig deeper to get a grasp of the situation
The graphic below depicts how earnings and revenue have changed over time (unveil the exact values by clicking on the image).
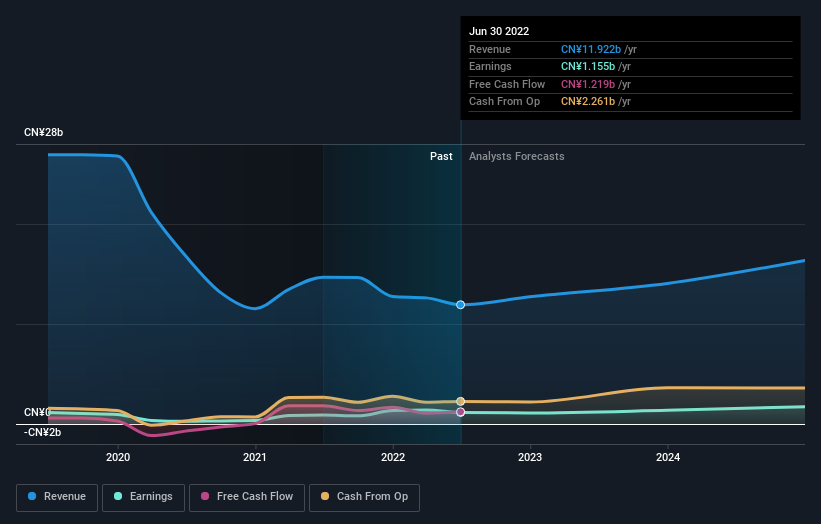 SHSE:600859 Earnings and Revenue Growth September 25th 2022
We know that Wangfujing Group has improved its bottom line lately, but what does the future have in store? You can see what analysts are predicting for Wangfujing Group in this interactive graph of future profit estimates.
What About Dividends?
When looking at investment returns, it is important to consider the difference between total shareholder return (TSR) and share price return. The TSR is a return calculation that accounts for the value of cash dividends (assuming that any dividend received was reinvested) and the calculated value of any discounted capital raisings and spin-offs. So for companies that pay a generous dividend, the TSR is often a lot higher than the share price return. We note that for Wangfujing Group the TSR over the last 3 years was 66%, which is better than the share price return mentioned above. And there's no prize for guessing that the dividend payments largely explain the divergence!
A Different Perspective
While the broader market lost about 17% in the twelve months, Wangfujing Group shareholders did even worse, losing 23% (even including dividends). Having said that, it's inevitable that some stocks will be oversold in a falling market. The key is to keep your eyes on the fundamental developments. Longer term investors wouldn't be so upset, since they would have made 7%, each year, over five years. It could be that the recent sell-off is an opportunity, so it may be worth checking the fundamental data for signs of a long term growth trend. While it is well worth considering the different impacts that market conditions can have on the share price, there are other factors that are even more important. Even so, be aware that Wangfujing Group is showing 2 warning signs in our investment analysis , you should know about...
If you like to buy stocks alongside management, then you might just love this free list of companies. (Hint: insiders have been buying them).
Please note, the market returns quoted in this article reflect the market weighted average returns of stocks that currently trade on CN exchanges.
Have feedback on this article? Concerned about the content? Get in touch with us directly. Alternatively, email editorial-team (at) simplywallst.com.
This article by Simply Wall St is general in nature. We provide commentary based on historical data and analyst forecasts only using an unbiased methodology and our articles are not intended to be financial advice. It does not constitute a recommendation to buy or sell any stock, and does not take account of your objectives, or your financial situation. We aim to bring you long-term focused analysis driven by fundamental data. Note that our analysis may not factor in the latest price-sensitive company announcements or qualitative material. Simply Wall St has no position in any stocks mentioned.