
It might be of some concern to shareholders to see the Installed Building Products, Inc. (NYSE:IBP) share price down 19% in the last month. In contrast the stock has done reasonably well over three years. In fact the stock is up 36%, which is better than the market return of 32%.
While this past week has detracted from the company's three-year return, let's look at the recent trends of the underlying business and see if the gains have been in alignment.
See our latest analysis for Installed Building Products
In his essay The Superinvestors of Graham-and-Doddsville Warren Buffett described how share prices do not always rationally reflect the value of a business. One way to examine how market sentiment has changed over time is to look at the interaction between a company's share price and its earnings per share (EPS).
Installed Building Products was able to grow its EPS at 41% per year over three years, sending the share price higher. The average annual share price increase of 11% is actually lower than the EPS growth. So it seems investors have become more cautious about the company, over time.
You can see below how EPS has changed over time (discover the exact values by clicking on the image).
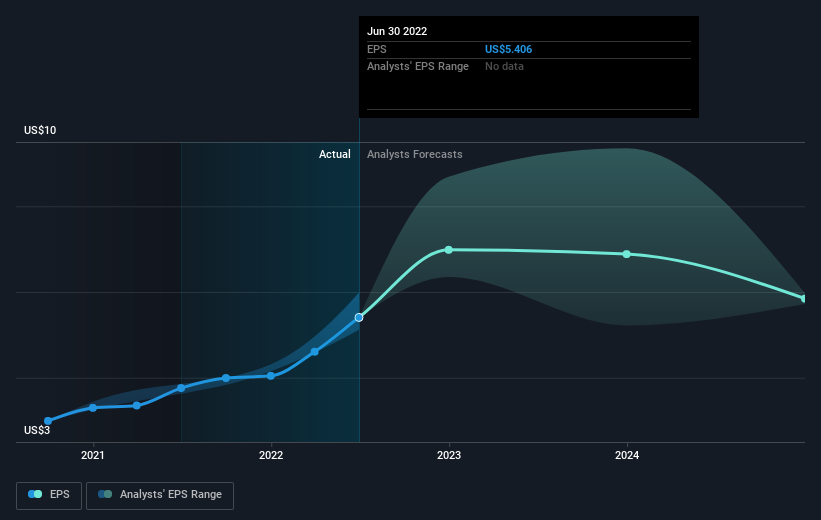 NYSE:IBP Earnings Per Share Growth September 23rd 2022
It is of course excellent to see how Installed Building Products has grown profits over the years, but the future is more important for shareholders. It might be well worthwhile taking a look at our free report on how its financial position has changed over time.
What About Dividends?
It is important to consider the total shareholder return, as well as the share price return, for any given stock. The TSR incorporates the value of any spin-offs or discounted capital raisings, along with any dividends, based on the assumption that the dividends are reinvested. Arguably, the TSR gives a more comprehensive picture of the return generated by a stock. As it happens, Installed Building Products' TSR for the last 3 years was 40%, which exceeds the share price return mentioned earlier. The dividends paid by the company have thusly boosted the total shareholder return.
A Different Perspective
While the broader market lost about 20% in the twelve months, Installed Building Products shareholders did even worse, losing 28% (even including dividends). Having said that, it's inevitable that some stocks will be oversold in a falling market. The key is to keep your eyes on the fundamental developments. On the bright side, long term shareholders have made money, with a gain of 5% per year over half a decade. It could be that the recent sell-off is an opportunity, so it may be worth checking the fundamental data for signs of a long term growth trend. While it is well worth considering the different impacts that market conditions can have on the share price, there are other factors that are even more important. Consider for instance, the ever-present spectre of investment risk. We've identified 3 warning signs with Installed Building Products (at least 2 which are a bit unpleasant) , and understanding them should be part of your investment process.
Of course Installed Building Products may not be the best stock to buy. So you may wish to see this free collection of growth stocks.
Please note, the market returns quoted in this article reflect the market weighted average returns of stocks that currently trade on US exchanges.
Have feedback on this article? Concerned about the content? Get in touch with us directly. Alternatively, email editorial-team (at) simplywallst.com.
This article by Simply Wall St is general in nature. We provide commentary based on historical data and analyst forecasts only using an unbiased methodology and our articles are not intended to be financial advice. It does not constitute a recommendation to buy or sell any stock, and does not take account of your objectives, or your financial situation. We aim to bring you long-term focused analysis driven by fundamental data. Note that our analysis may not factor in the latest price-sensitive company announcements or qualitative material. Simply Wall St has no position in any stocks mentioned.