
It might be of some concern to shareholders to see the Joinn Laboratories(China)Co.,Ltd. (SHSE:603127) share price down 22% in the last month. But that doesn't change the fact that the returns over the last half decade have been spectacular. To be precise, the stock price is 465% higher than it was five years ago, a wonderful performance by any measure. So we don't think the recent decline in the share price means its story is a sad one. But the real question is whether the business fundamentals can improve over the long term. While the long term returns are impressive, we do have some sympathy for those who bought more recently, given the 50% drop, in the last year.
Since the long term performance has been good but there's been a recent pullback of 4.5%, let's check if the fundamentals match the share price.
View our latest analysis for Joinn Laboratories(China)Co.Ltd
There is no denying that markets are sometimes efficient, but prices do not always reflect underlying business performance. One flawed but reasonable way to assess how sentiment around a company has changed is to compare the earnings per share (EPS) with the share price.
During five years of share price growth, Joinn Laboratories(China)Co.Ltd achieved compound earnings per share (EPS) growth of 46% per year. This EPS growth is reasonably close to the 41% average annual increase in the share price. This indicates that investor sentiment towards the company has not changed a great deal. Rather, the share price has approximately tracked EPS growth.
You can see below how EPS has changed over time (discover the exact values by clicking on the image).
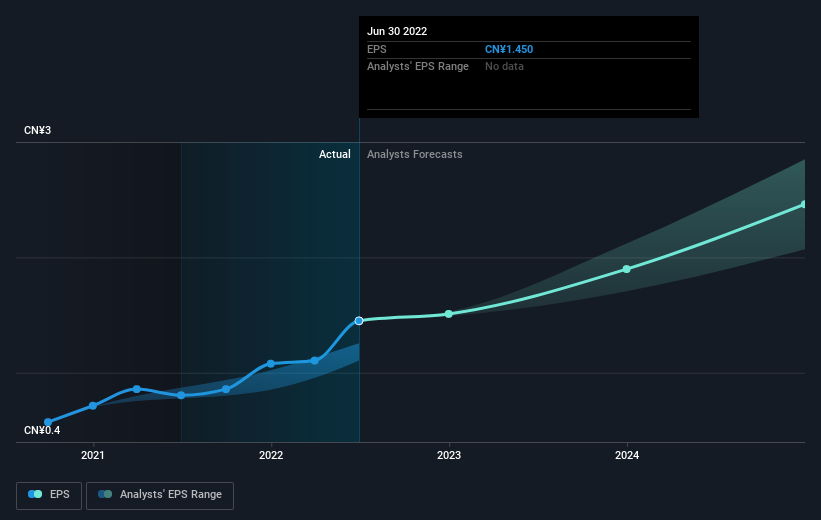 SHSE:603127 Earnings Per Share Growth September 21st 2022
We know that Joinn Laboratories(China)Co.Ltd has improved its bottom line over the last three years, but what does the future have in store? This free interactive report on Joinn Laboratories(China)Co.Ltd's balance sheet strength is a great place to start, if you want to investigate the stock further.
What About Dividends?
It is important to consider the total shareholder return, as well as the share price return, for any given stock. Whereas the share price return only reflects the change in the share price, the TSR includes the value of dividends (assuming they were reinvested) and the benefit of any discounted capital raising or spin-off. It's fair to say that the TSR gives a more complete picture for stocks that pay a dividend. We note that for Joinn Laboratories(China)Co.Ltd the TSR over the last 5 years was 473%, which is better than the share price return mentioned above. And there's no prize for guessing that the dividend payments largely explain the divergence!
A Different Perspective
While the broader market lost about 16% in the twelve months, Joinn Laboratories(China)Co.Ltd shareholders did even worse, losing 50% (even including dividends). However, it could simply be that the share price has been impacted by broader market jitters. It might be worth keeping an eye on the fundamentals, in case there's a good opportunity. Longer term investors wouldn't be so upset, since they would have made 42%, each year, over five years. It could be that the recent sell-off is an opportunity, so it may be worth checking the fundamental data for signs of a long term growth trend. It's always interesting to track share price performance over the longer term. But to understand Joinn Laboratories(China)Co.Ltd better, we need to consider many other factors. Consider for instance, the ever-present spectre of investment risk. We've identified 1 warning sign with Joinn Laboratories(China)Co.Ltd , and understanding them should be part of your investment process.
If you are like me, then you will not want to miss this free list of growing companies that insiders are buying.
Please note, the market returns quoted in this article reflect the market weighted average returns of stocks that currently trade on CN exchanges.
Have feedback on this article? Concerned about the content? Get in touch with us directly. Alternatively, email editorial-team (at) simplywallst.com.
This article by Simply Wall St is general in nature. We provide commentary based on historical data and analyst forecasts only using an unbiased methodology and our articles are not intended to be financial advice. It does not constitute a recommendation to buy or sell any stock, and does not take account of your objectives, or your financial situation. We aim to bring you long-term focused analysis driven by fundamental data. Note that our analysis may not factor in the latest price-sensitive company announcements or qualitative material. Simply Wall St has no position in any stocks mentioned.