
The main aim of stock picking is to find the market-beating stocks. But in any portfolio, there will be mixed results between individual stocks. So we wouldn't blame long term Standex International Corporation (NYSE:SXI) shareholders for doubting their decision to hold, with the stock down 20% over a half decade. More recently, the share price has dropped a further 17% in a month. We do note, however, that the broader market is down 9.3% in that period, and this may have weighed on the share price.
If the past week is anything to go by, investor sentiment for Standex International isn't positive, so let's see if there's a mismatch between fundamentals and the share price.
See our latest analysis for Standex International
To quote Buffett, 'Ships will sail around the world but the Flat Earth Society will flourish. There will continue to be wide discrepancies between price and value in the marketplace...' One imperfect but simple way to consider how the market perception of a company has shifted is to compare the change in the earnings per share (EPS) with the share price movement.
During the unfortunate half decade during which the share price slipped, Standex International actually saw its earnings per share (EPS) improve by 11% per year. Given the share price reaction, one might suspect that EPS is not a good guide to the business performance during the period (perhaps due to a one-off loss or gain). Alternatively, growth expectations may have been unreasonable in the past.
Generally speaking we'd expect to see stronger share price increases on the back of sustained EPS growth, but other metrics may hold a clue to why the share price performance is relatively modest.
The modest 1.3% dividend yield is unlikely to be guiding the market view of the stock. The revenue fall of 1.4% per year for five years is neither good nor terrible. But it's quite possible the market had expected better; a closer look at the revenue trends might explain the pessimism.
The company's revenue and earnings (over time) are depicted in the image below (click to see the exact numbers).
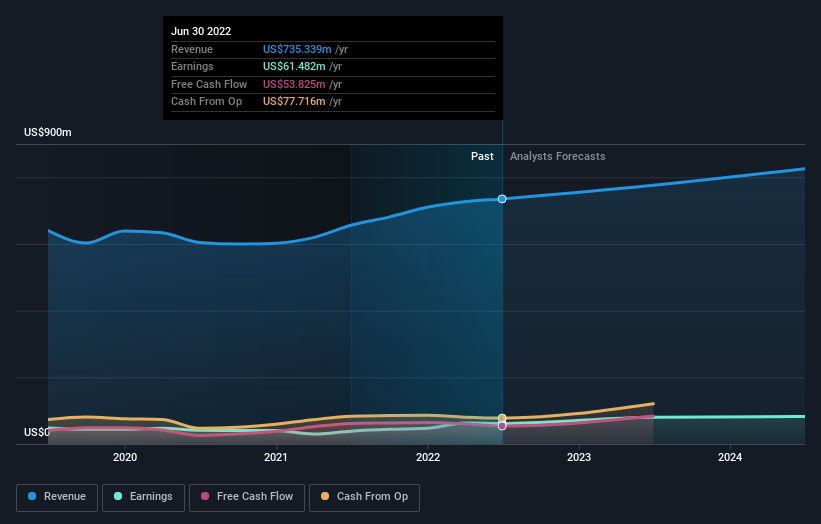 NYSE:SXI Earnings and Revenue Growth September 18th 2022
We know that Standex International has improved its bottom line lately, but what does the future have in store? So it makes a lot of sense to check out what analysts think Standex International will earn in the future (free profit forecasts).
What About Dividends?
When looking at investment returns, it is important to consider the difference between total shareholder return (TSR) and share price return. The TSR is a return calculation that accounts for the value of cash dividends (assuming that any dividend received was reinvested) and the calculated value of any discounted capital raisings and spin-offs. So for companies that pay a generous dividend, the TSR is often a lot higher than the share price return. In the case of Standex International, it has a TSR of -15% for the last 5 years. That exceeds its share price return that we previously mentioned. This is largely a result of its dividend payments!
A Different Perspective
While it's certainly disappointing to see that Standex International shares lost 15% throughout the year, that wasn't as bad as the market loss of 17%. Given the total loss of 3% per year over five years, it seems returns have deteriorated in the last twelve months. While some investors do well specializing in buying companies that are struggling (but nonetheless undervalued), don't forget that Buffett said that 'turnarounds seldom turn'. Before spending more time on Standex International it might be wise to click here to see if insiders have been buying or selling shares.
Of course, you might find a fantastic investment by looking elsewhere. So take a peek at this free list of companies we expect will grow earnings.
Please note, the market returns quoted in this article reflect the market weighted average returns of stocks that currently trade on US exchanges.
Have feedback on this article? Concerned about the content? Get in touch with us directly. Alternatively, email editorial-team (at) simplywallst.com.
This article by Simply Wall St is general in nature. We provide commentary based on historical data and analyst forecasts only using an unbiased methodology and our articles are not intended to be financial advice. It does not constitute a recommendation to buy or sell any stock, and does not take account of your objectives, or your financial situation. We aim to bring you long-term focused analysis driven by fundamental data. Note that our analysis may not factor in the latest price-sensitive company announcements or qualitative material. Simply Wall St has no position in any stocks mentioned.