
Ideally, your overall portfolio should beat the market average. But in any portfolio, there will be mixed results between individual stocks. So we wouldn't blame long term Changzhou Tenglong AutoPartsCo.,Ltd. (SHSE:603158) shareholders for doubting their decision to hold, with the stock down 28% over a half decade. Even worse, it's down 19% in about a month, which isn't fun at all. Importantly, this could be a market reaction to the recently released financial results. You can check out the latest numbers in our company report.
After losing 9.9% this past week, it's worth investigating the company's fundamentals to see what we can infer from past performance.
See our latest analysis for Changzhou Tenglong AutoPartsCo.Ltd
While the efficient markets hypothesis continues to be taught by some, it has been proven that markets are over-reactive dynamic systems, and investors are not always rational. One way to examine how market sentiment has changed over time is to look at the interaction between a company's share price and its earnings per share (EPS).
Looking back five years, both Changzhou Tenglong AutoPartsCo.Ltd's share price and EPS declined; the latter at a rate of 14% per year. The share price decline of 6% per year isn't as bad as the EPS decline. The relatively muted share price reaction might be because the market expects the business to turn around. The high P/E ratio of 51.26 suggests that shareholders believe earnings will grow in the years ahead.
The company's earnings per share (over time) is depicted in the image below (click to see the exact numbers).
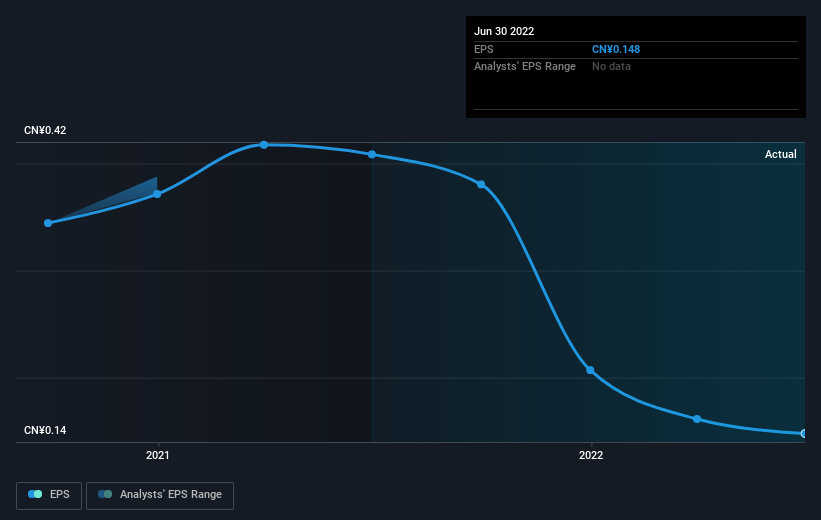 SHSE:603158 Earnings Per Share Growth September 15th 2022
This free interactive report on Changzhou Tenglong AutoPartsCo.Ltd's earnings, revenue and cash flow is a great place to start, if you want to investigate the stock further.
What About Dividends?
It is important to consider the total shareholder return, as well as the share price return, for any given stock. The TSR is a return calculation that accounts for the value of cash dividends (assuming that any dividend received was reinvested) and the calculated value of any discounted capital raisings and spin-offs. It's fair to say that the TSR gives a more complete picture for stocks that pay a dividend. In the case of Changzhou Tenglong AutoPartsCo.Ltd, it has a TSR of -24% for the last 5 years. That exceeds its share price return that we previously mentioned. The dividends paid by the company have thusly boosted the total shareholder return.
A Different Perspective
While the broader market lost about 13% in the twelve months, Changzhou Tenglong AutoPartsCo.Ltd shareholders did even worse, losing 18% (even including dividends). Having said that, it's inevitable that some stocks will be oversold in a falling market. The key is to keep your eyes on the fundamental developments. Regrettably, last year's performance caps off a bad run, with the shareholders facing a total loss of 4% per year over five years. We realise that Baron Rothschild has said investors should "buy when there is blood on the streets", but we caution that investors should first be sure they are buying a high quality business. I find it very interesting to look at share price over the long term as a proxy for business performance. But to truly gain insight, we need to consider other information, too. For instance, we've identified 3 warning signs for Changzhou Tenglong AutoPartsCo.Ltd (1 is potentially serious) that you should be aware of.
If you like to buy stocks alongside management, then you might just love this free list of companies. (Hint: insiders have been buying them).
Please note, the market returns quoted in this article reflect the market weighted average returns of stocks that currently trade on CN exchanges.
Have feedback on this article? Concerned about the content? Get in touch with us directly. Alternatively, email editorial-team (at) simplywallst.com.
This article by Simply Wall St is general in nature. We provide commentary based on historical data and analyst forecasts only using an unbiased methodology and our articles are not intended to be financial advice. It does not constitute a recommendation to buy or sell any stock, and does not take account of your objectives, or your financial situation. We aim to bring you long-term focused analysis driven by fundamental data. Note that our analysis may not factor in the latest price-sensitive company announcements or qualitative material. Simply Wall St has no position in any stocks mentioned.