
Ideally, your overall portfolio should beat the market average. But if you pick the right individual stocks, you could make more -- or less -- than that. While the CGN Power Co., Ltd. (HKG:1816) share price is down 14% over half a decade, the total return to shareholders (which includes dividends) was 7.7%. That's better than the market which declined 5.1% over the same time.
It's worthwhile assessing if the company's economics have been moving in lockstep with these underwhelming shareholder returns, or if there is some disparity between the two. So let's do just that.
Check out our latest analysis for CGN Power
While the efficient markets hypothesis continues to be taught by some, it has been proven that markets are over-reactive dynamic systems, and investors are not always rational. One flawed but reasonable way to assess how sentiment around a company has changed is to compare the earnings per share (EPS) with the share price.
Looking back five years, both CGN Power's share price and EPS declined; the latter at a rate of 1.1% per year. Readers should note that the share price has fallen faster than the EPS, at a rate of 3% per year, over the period. This implies that the market was previously too optimistic about the stock. The low P/E ratio of 8.26 further reflects this reticence.
The graphic below depicts how EPS has changed over time (unveil the exact values by clicking on the image).
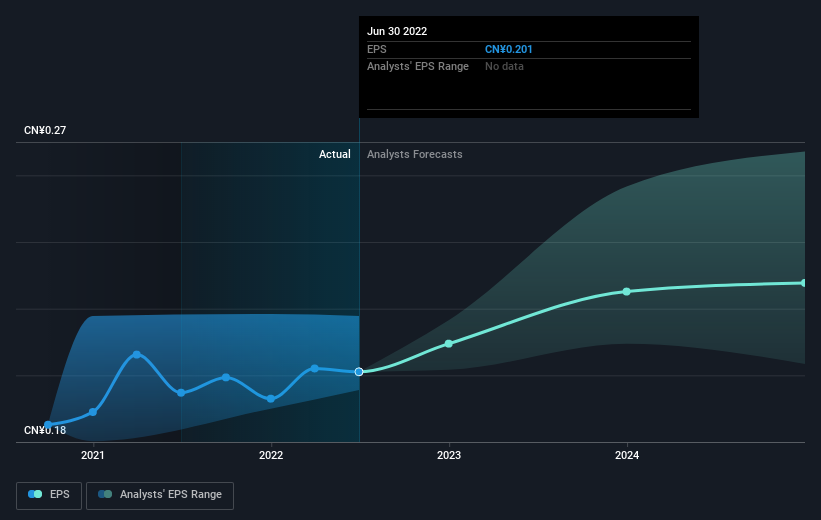 SEHK:1816 Earnings Per Share Growth September 14th 2022
We're pleased to report that the CEO is remunerated more modestly than most CEOs at similarly capitalized companies. But while CEO remuneration is always worth checking, the really important question is whether the company can grow earnings going forward. This free interactive report on CGN Power's earnings, revenue and cash flow is a great place to start, if you want to investigate the stock further.
What About Dividends?
It is important to consider the total shareholder return, as well as the share price return, for any given stock. The TSR is a return calculation that accounts for the value of cash dividends (assuming that any dividend received was reinvested) and the calculated value of any discounted capital raisings and spin-offs. It's fair to say that the TSR gives a more complete picture for stocks that pay a dividend. We note that for CGN Power the TSR over the last 5 years was 7.7%, which is better than the share price return mentioned above. And there's no prize for guessing that the dividend payments largely explain the divergence!
A Different Perspective
While it's never nice to take a loss, CGN Power shareholders can take comfort that , including dividends,their trailing twelve month loss of 7.3% wasn't as bad as the market loss of around 20%. Of course, the long term returns are far more important and the good news is that over five years, the stock has returned 1.5% for each year. In the best case scenario the last year is just a temporary blip on the journey to a brighter future. I find it very interesting to look at share price over the long term as a proxy for business performance. But to truly gain insight, we need to consider other information, too. Consider for instance, the ever-present spectre of investment risk. We've identified 2 warning signs with CGN Power (at least 1 which is concerning) , and understanding them should be part of your investment process.
But note: CGN Power may not be the best stock to buy. So take a peek at this free list of interesting companies with past earnings growth (and further growth forecast).
Please note, the market returns quoted in this article reflect the market weighted average returns of stocks that currently trade on HK exchanges.
Have feedback on this article? Concerned about the content? Get in touch with us directly. Alternatively, email editorial-team (at) simplywallst.com.
This article by Simply Wall St is general in nature. We provide commentary based on historical data and analyst forecasts only using an unbiased methodology and our articles are not intended to be financial advice. It does not constitute a recommendation to buy or sell any stock, and does not take account of your objectives, or your financial situation. We aim to bring you long-term focused analysis driven by fundamental data. Note that our analysis may not factor in the latest price-sensitive company announcements or qualitative material. Simply Wall St has no position in any stocks mentioned.