
While not a mind-blowing move, it is good to see that the Nexteer Automotive Group Limited (HKG:1316) share price has gained 14% in the last three months. But that is little comfort to those holding over the last half decade, sitting on a big loss. Indeed, the share price is down 57% in the period. So we're not so sure if the recent bounce should be celebrated. But it could be that the fall was overdone.
While the stock has risen 3.1% in the past week but long term shareholders are still in the red, let's see what the fundamentals can tell us.
View our latest analysis for Nexteer Automotive Group
While markets are a powerful pricing mechanism, share prices reflect investor sentiment, not just underlying business performance. One way to examine how market sentiment has changed over time is to look at the interaction between a company's share price and its earnings per share (EPS).
During the five years over which the share price declined, Nexteer Automotive Group's earnings per share (EPS) dropped by 41% each year. This fall in the EPS is worse than the 16% compound annual share price fall. The relatively muted share price reaction might be because the market expects the business to turn around. With a P/E ratio of 75.23, it's fair to say the market sees a brighter future for the business.
The graphic below depicts how EPS has changed over time (unveil the exact values by clicking on the image).
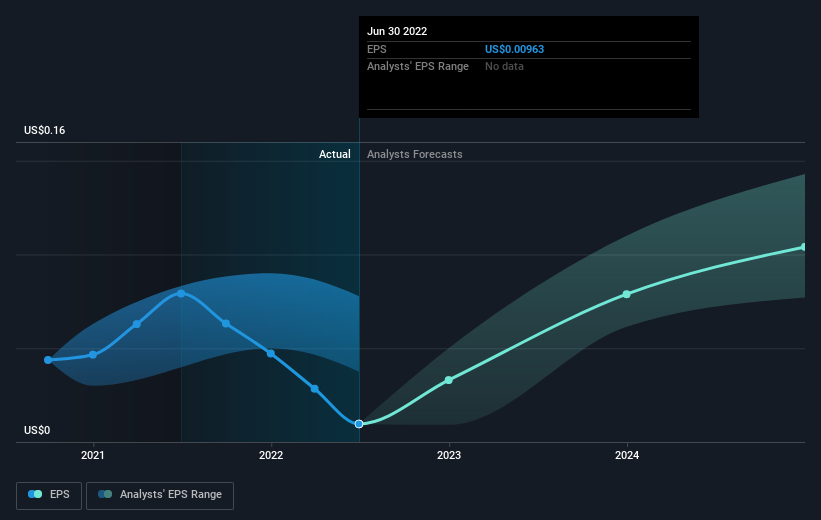 SEHK:1316 Earnings Per Share Growth September 14th 2022
We're pleased to report that the CEO is remunerated more modestly than most CEOs at similarly capitalized companies. It's always worth keeping an eye on CEO pay, but a more important question is whether the company will grow earnings throughout the years. Dive deeper into the earnings by checking this interactive graph of Nexteer Automotive Group's earnings, revenue and cash flow.
What About Dividends?
As well as measuring the share price return, investors should also consider the total shareholder return (TSR). The TSR is a return calculation that accounts for the value of cash dividends (assuming that any dividend received was reinvested) and the calculated value of any discounted capital raisings and spin-offs. Arguably, the TSR gives a more comprehensive picture of the return generated by a stock. We note that for Nexteer Automotive Group the TSR over the last 5 years was -52%, which is better than the share price return mentioned above. And there's no prize for guessing that the dividend payments largely explain the divergence!
A Different Perspective
While the broader market lost about 22% in the twelve months, Nexteer Automotive Group shareholders did even worse, losing 30% (even including dividends). However, it could simply be that the share price has been impacted by broader market jitters. It might be worth keeping an eye on the fundamentals, in case there's a good opportunity. Unfortunately, last year's performance may indicate unresolved challenges, given that it was worse than the annualised loss of 9% over the last half decade. We realise that Baron Rothschild has said investors should "buy when there is blood on the streets", but we caution that investors should first be sure they are buying a high quality business. It's always interesting to track share price performance over the longer term. But to understand Nexteer Automotive Group better, we need to consider many other factors. For instance, we've identified 1 warning sign for Nexteer Automotive Group that you should be aware of.
If you are like me, then you will not want to miss this free list of growing companies that insiders are buying.
Please note, the market returns quoted in this article reflect the market weighted average returns of stocks that currently trade on HK exchanges.
Have feedback on this article? Concerned about the content? Get in touch with us directly. Alternatively, email editorial-team (at) simplywallst.com.
This article by Simply Wall St is general in nature. We provide commentary based on historical data and analyst forecasts only using an unbiased methodology and our articles are not intended to be financial advice. It does not constitute a recommendation to buy or sell any stock, and does not take account of your objectives, or your financial situation. We aim to bring you long-term focused analysis driven by fundamental data. Note that our analysis may not factor in the latest price-sensitive company announcements or qualitative material. Simply Wall St has no position in any stocks mentioned.