
If you are building a properly diversified stock portfolio, the chances are some of your picks will perform badly. But long term PROG Holdings, Inc. (NYSE:PRG) shareholders have had a particularly rough ride in the last three year. Unfortunately, they have held through a 67% decline in the share price in that time. And the ride hasn't got any smoother in recent times over the last year, with the price 55% lower in that time. The falls have accelerated recently, with the share price down 22% in the last three months.
The recent uptick of 8.6% could be a positive sign of things to come, so let's take a lot at historical fundamentals.
See our latest analysis for PROG Holdings
To paraphrase Benjamin Graham: Over the short term the market is a voting machine, but over the long term it's a weighing machine. By comparing earnings per share (EPS) and share price changes over time, we can get a feel for how investor attitudes to a company have morphed over time.
During the three years that the share price fell, PROG Holdings' earnings per share (EPS) dropped by 2.2% each year. The share price decline of 31% is actually steeper than the EPS slippage. So it's likely that the EPS decline has disappointed the market, leaving investors hesitant to buy. This increased caution is also evident in the rather low P/E ratio, which is sitting at 7.27.
The graphic below depicts how EPS has changed over time (unveil the exact values by clicking on the image).
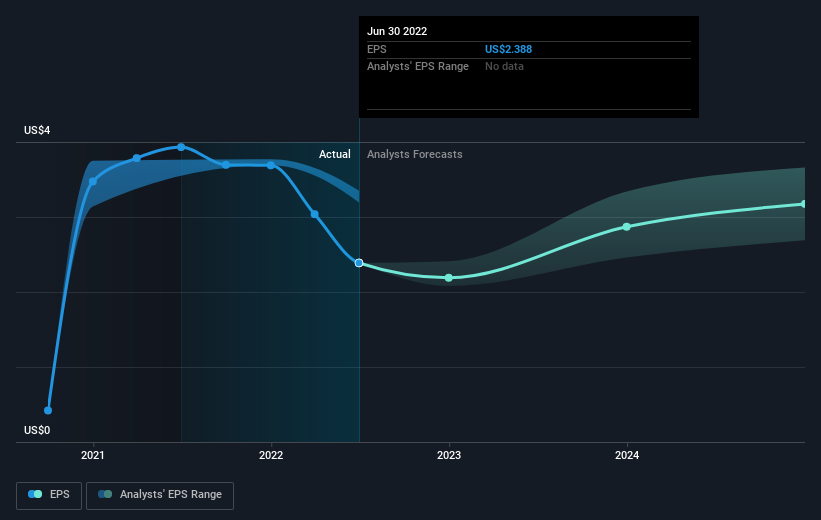 NYSE:PRG Earnings Per Share Growth September 10th 2022
It's probably worth noting we've seen significant insider buying in the last quarter, which we consider a positive. On the other hand, we think the revenue and earnings trends are much more meaningful measures of the business. This free interactive report on PROG Holdings' earnings, revenue and cash flow is a great place to start, if you want to investigate the stock further.
What About The Total Shareholder Return (TSR)?
We'd be remiss not to mention the difference between PROG Holdings' total shareholder return (TSR) and its share price return. The TSR is a return calculation that accounts for the value of cash dividends (assuming that any dividend received was reinvested) and the calculated value of any discounted capital raisings and spin-offs. Dividends have been really beneficial for PROG Holdings shareholders, and that cash payout explains why its total shareholder loss of 61%, over the last 3 years, isn't as bad as the share price return.
A Different Perspective
We regret to report that PROG Holdings shareholders are down 55% for the year. Unfortunately, that's worse than the broader market decline of 14%. Having said that, it's inevitable that some stocks will be oversold in a falling market. The key is to keep your eyes on the fundamental developments. Unfortunately, last year's performance may indicate unresolved challenges, given that it was worse than the annualised loss of 7% over the last half decade. We realise that Baron Rothschild has said investors should "buy when there is blood on the streets", but we caution that investors should first be sure they are buying a high quality business. I find it very interesting to look at share price over the long term as a proxy for business performance. But to truly gain insight, we need to consider other information, too. Take risks, for example - PROG Holdings has 4 warning signs we think you should be aware of.
PROG Holdings is not the only stock that insiders are buying. For those who like to find winning investments this free list of growing companies with recent insider purchasing, could be just the ticket.
Please note, the market returns quoted in this article reflect the market weighted average returns of stocks that currently trade on US exchanges.
Have feedback on this article? Concerned about the content? Get in touch with us directly. Alternatively, email editorial-team (at) simplywallst.com.
This article by Simply Wall St is general in nature. We provide commentary based on historical data and analyst forecasts only using an unbiased methodology and our articles are not intended to be financial advice. It does not constitute a recommendation to buy or sell any stock, and does not take account of your objectives, or your financial situation. We aim to bring you long-term focused analysis driven by fundamental data. Note that our analysis may not factor in the latest price-sensitive company announcements or qualitative material. Simply Wall St has no position in any stocks mentioned.