
It is hard to get excited after looking at Standex International's (NYSE:SXI) recent performance, when its stock has declined 11% over the past week. However, a closer look at its sound financials might cause you to think again. Given that fundamentals usually drive long-term market outcomes, the company is worth looking at. Specifically, we decided to study Standex International's ROE in this article.
ROE or return on equity is a useful tool to assess how effectively a company can generate returns on the investment it received from its shareholders. Simply put, it is used to assess the profitability of a company in relation to its equity capital.
Check out our latest analysis for Standex International
How Is ROE Calculated?
ROE can be calculated by using the formula:
Return on Equity = Net Profit (from continuing operations) ÷ Shareholders' Equity
So, based on the above formula, the ROE for Standex International is:
12% = US$61m ÷ US$499m (Based on the trailing twelve months to June 2022).
The 'return' is the income the business earned over the last year. One way to conceptualize this is that for each $1 of shareholders' capital it has, the company made $0.12 in profit.
What Has ROE Got To Do With Earnings Growth?
Thus far, we have learned that ROE measures how efficiently a company is generating its profits. Based on how much of its profits the company chooses to reinvest or "retain", we are then able to evaluate a company's future ability to generate profits. Assuming all else is equal, companies that have both a higher return on equity and higher profit retention are usually the ones that have a higher growth rate when compared to companies that don't have the same features.
Standex International's Earnings Growth And 12% ROE
To start with, Standex International's ROE looks acceptable. Further, the company's ROE is similar to the industry average of 13%. Consequently, this likely laid the ground for the decent growth of 6.7% seen over the past five years by Standex International.
We then compared Standex International's net income growth with the industry and found that the company's growth figure is lower than the average industry growth rate of 8.6% in the same period, which is a bit concerning.
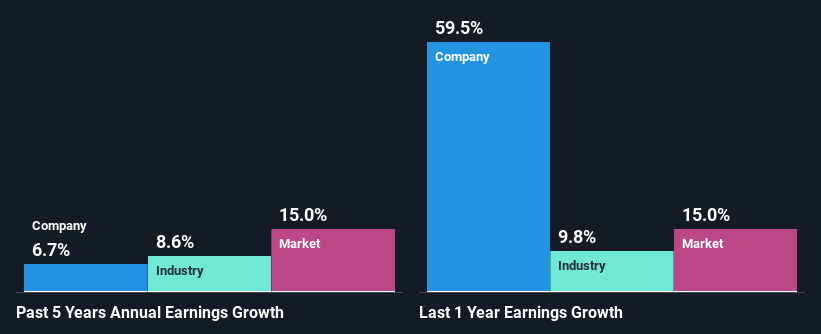 NYSE:SXI Past Earnings Growth September 2nd 2022
The basis for attaching value to a company is, to a great extent, tied to its earnings growth. What investors need to determine next is if the expected earnings growth, or the lack of it, is already built into the share price. By doing so, they will have an idea if the stock is headed into clear blue waters or if swampy waters await. One good indicator of expected earnings growth is the P/E ratio which determines the price the market is willing to pay for a stock based on its earnings prospects. So, you may want to check if Standex International is trading on a high P/E or a low P/E, relative to its industry.
Is Standex International Using Its Retained Earnings Effectively?
With a three-year median payout ratio of 25% (implying that the company retains 75% of its profits), it seems that Standex International is reinvesting efficiently in a way that it sees respectable amount growth in its earnings and pays a dividend that's well covered.
Besides, Standex International has been paying dividends for at least ten years or more. This shows that the company is committed to sharing profits with its shareholders.
Summary
Overall, we are quite pleased with Standex International's performance. Particularly, we like that the company is reinvesting heavily into its business, and at a high rate of return. As a result, the decent growth in its earnings is not surprising. That being so, the latest analyst forecasts show that the company will continue to see an expansion in its earnings. To know more about the latest analysts predictions for the company, check out this visualization of analyst forecasts for the company.
Have feedback on this article? Concerned about the content? Get in touch with us directly. Alternatively, email editorial-team (at) simplywallst.com.
This article by Simply Wall St is general in nature. We provide commentary based on historical data and analyst forecasts only using an unbiased methodology and our articles are not intended to be financial advice. It does not constitute a recommendation to buy or sell any stock, and does not take account of your objectives, or your financial situation. We aim to bring you long-term focused analysis driven by fundamental data. Note that our analysis may not factor in the latest price-sensitive company announcements or qualitative material. Simply Wall St has no position in any stocks mentioned.