
Chinasoft International Limited (HKG:354) shareholders might be concerned after seeing the share price drop 15% in the last quarter. But over three years, the returns would have left most investors smiling To wit, the share price did better than an index fund, climbing 81% during that period.
Although Chinasoft International has shed CN¥2.7b from its market cap this week, let's take a look at its longer term fundamental trends and see if they've driven returns.
See our latest analysis for Chinasoft International
While markets are a powerful pricing mechanism, share prices reflect investor sentiment, not just underlying business performance. One flawed but reasonable way to assess how sentiment around a company has changed is to compare the earnings per share (EPS) with the share price.
During three years of share price growth, Chinasoft International achieved compound earnings per share growth of 9.9% per year. This EPS growth is lower than the 22% average annual increase in the share price. This suggests that, as the business progressed over the last few years, it gained the confidence of market participants. It's not unusual to see the market 're-rate' a stock, after a few years of growth.
You can see how EPS has changed over time in the image below (click on the chart to see the exact values).
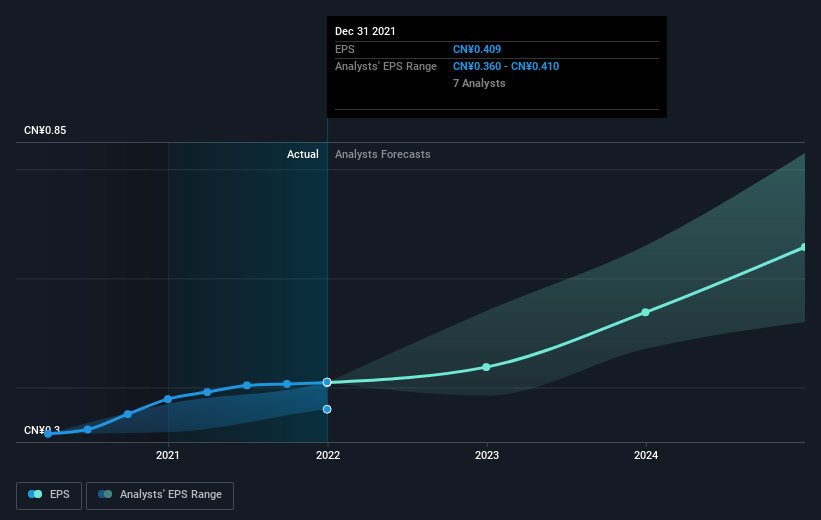 SEHK:354 Earnings Per Share Growth August 30th 2022
It's probably worth noting we've seen significant insider buying in the last quarter, which we consider a positive. That said, we think earnings and revenue growth trends are even more important factors to consider. Before buying or selling a stock, we always recommend a close examination of historic growth trends, available here..
What About Dividends?
As well as measuring the share price return, investors should also consider the total shareholder return (TSR). Whereas the share price return only reflects the change in the share price, the TSR includes the value of dividends (assuming they were reinvested) and the benefit of any discounted capital raising or spin-off. So for companies that pay a generous dividend, the TSR is often a lot higher than the share price return. We note that for Chinasoft International the TSR over the last 3 years was 83%, which is better than the share price return mentioned above. This is largely a result of its dividend payments!
A Different Perspective
We regret to report that Chinasoft International shareholders are down 53% for the year (even including dividends). Unfortunately, that's worse than the broader market decline of 19%. Having said that, it's inevitable that some stocks will be oversold in a falling market. The key is to keep your eyes on the fundamental developments. On the bright side, long term shareholders have made money, with a gain of 7% per year over half a decade. It could be that the recent sell-off is an opportunity, so it may be worth checking the fundamental data for signs of a long term growth trend. It's always interesting to track share price performance over the longer term. But to understand Chinasoft International better, we need to consider many other factors. Consider risks, for instance. Every company has them, and we've spotted 1 warning sign for Chinasoft International you should know about.
Chinasoft International is not the only stock that insiders are buying. For those who like to find winning investments this free list of growing companies with recent insider purchasing, could be just the ticket.
Please note, the market returns quoted in this article reflect the market weighted average returns of stocks that currently trade on HK exchanges.
Have feedback on this article? Concerned about the content? Get in touch with us directly. Alternatively, email editorial-team (at) simplywallst.com.
This article by Simply Wall St is general in nature. We provide commentary based on historical data and analyst forecasts only using an unbiased methodology and our articles are not intended to be financial advice. It does not constitute a recommendation to buy or sell any stock, and does not take account of your objectives, or your financial situation. We aim to bring you long-term focused analysis driven by fundamental data. Note that our analysis may not factor in the latest price-sensitive company announcements or qualitative material. Simply Wall St has no position in any stocks mentioned.