
Shougang Fushan Resources Group Limited (HKG:639) shareholders might be concerned after seeing the share price drop 16% in the last quarter. But don't let that distract from the very nice return generated over three years. To wit, the share price did better than an index fund, climbing 73% during that period.
On the back of a solid 7-day performance, let's check what role the company's fundamentals have played in driving long term shareholder returns.
See our latest analysis for Shougang Fushan Resources Group
While markets are a powerful pricing mechanism, share prices reflect investor sentiment, not just underlying business performance. One imperfect but simple way to consider how the market perception of a company has shifted is to compare the change in the earnings per share (EPS) with the share price movement.
Shougang Fushan Resources Group was able to grow its EPS at 34% per year over three years, sending the share price higher. The average annual share price increase of 20% is actually lower than the EPS growth. So it seems investors have become more cautious about the company, over time. We'd venture the lowish P/E ratio of 5.67 also reflects the negative sentiment around the stock.
You can see below how EPS has changed over time (discover the exact values by clicking on the image).
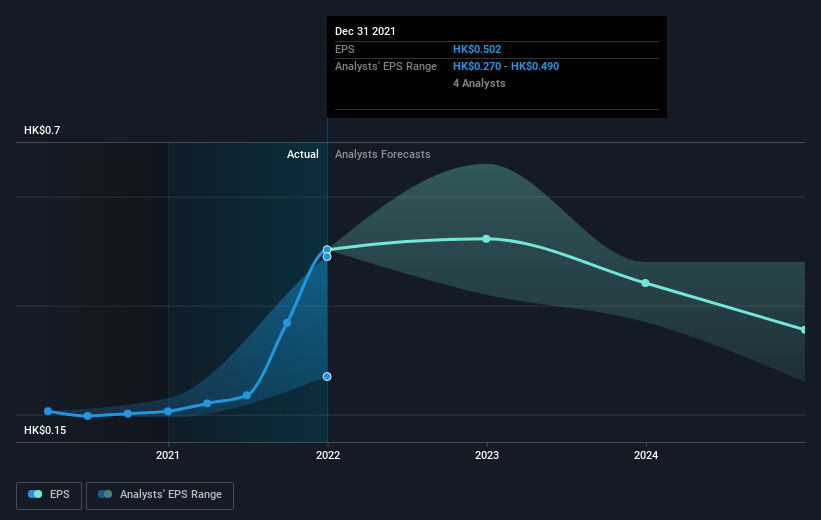 SEHK:639 Earnings Per Share Growth August 29th 2022
We like that insiders have been buying shares in the last twelve months. Even so, future earnings will be far more important to whether current shareholders make money. Before buying or selling a stock, we always recommend a close examination of historic growth trends, available here..
What About Dividends?
When looking at investment returns, it is important to consider the difference between total shareholder return (TSR) and share price return. Whereas the share price return only reflects the change in the share price, the TSR includes the value of dividends (assuming they were reinvested) and the benefit of any discounted capital raising or spin-off. Arguably, the TSR gives a more comprehensive picture of the return generated by a stock. We note that for Shougang Fushan Resources Group the TSR over the last 3 years was 140%, which is better than the share price return mentioned above. And there's no prize for guessing that the dividend payments largely explain the divergence!
A Different Perspective
We're pleased to report that Shougang Fushan Resources Group shareholders have received a total shareholder return of 38% over one year. Of course, that includes the dividend. That gain is better than the annual TSR over five years, which is 20%. Therefore it seems like sentiment around the company has been positive lately. Someone with an optimistic perspective could view the recent improvement in TSR as indicating that the business itself is getting better with time. I find it very interesting to look at share price over the long term as a proxy for business performance. But to truly gain insight, we need to consider other information, too. To that end, you should learn about the 2 warning signs we've spotted with Shougang Fushan Resources Group (including 1 which is significant) .
Shougang Fushan Resources Group is not the only stock insiders are buying. So take a peek at this free list of growing companies with insider buying.
Please note, the market returns quoted in this article reflect the market weighted average returns of stocks that currently trade on HK exchanges.
Have feedback on this article? Concerned about the content? Get in touch with us directly. Alternatively, email editorial-team (at) simplywallst.com.
This article by Simply Wall St is general in nature. We provide commentary based on historical data and analyst forecasts only using an unbiased methodology and our articles are not intended to be financial advice. It does not constitute a recommendation to buy or sell any stock, and does not take account of your objectives, or your financial situation. We aim to bring you long-term focused analysis driven by fundamental data. Note that our analysis may not factor in the latest price-sensitive company announcements or qualitative material. Simply Wall St has no position in any stocks mentioned.