
By buying an index fund, investors can approximate the average market return. But if you buy good businesses at attractive prices, your portfolio returns could exceed the average market return. For example, Zhejiang Hailide New Material Co.,Ltd (SZSE:002206) shareholders have seen the share price rise 82% over three years, well in excess of the market return (28%, not including dividends).
Since the long term performance has been good but there's been a recent pullback of 8.4%, let's check if the fundamentals match the share price.
Check out our latest analysis for Zhejiang Hailide New MaterialLtd
While markets are a powerful pricing mechanism, share prices reflect investor sentiment, not just underlying business performance. One flawed but reasonable way to assess how sentiment around a company has changed is to compare the earnings per share (EPS) with the share price.
Zhejiang Hailide New MaterialLtd was able to grow its EPS at 19% per year over three years, sending the share price higher. We note that the 22% yearly (average) share price gain isn't too far from the EPS growth rate. Coincidence? Probably not. This suggests that sentiment and expectations have not changed drastically. Rather, the share price has approximately tracked EPS growth.
The image below shows how EPS has tracked over time (if you click on the image you can see greater detail).
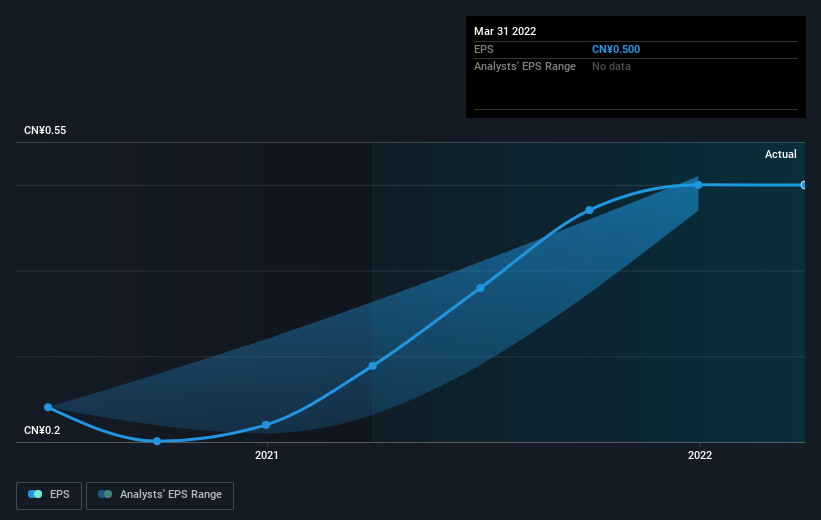 SZSE:002206 Earnings Per Share Growth August 28th 2022
Dive deeper into Zhejiang Hailide New MaterialLtd's key metrics by checking this interactive graph of Zhejiang Hailide New MaterialLtd's earnings, revenue and cash flow.
What About Dividends?
When looking at investment returns, it is important to consider the difference between total shareholder return (TSR) and share price return. Whereas the share price return only reflects the change in the share price, the TSR includes the value of dividends (assuming they were reinvested) and the benefit of any discounted capital raising or spin-off. Arguably, the TSR gives a more comprehensive picture of the return generated by a stock. In the case of Zhejiang Hailide New MaterialLtd, it has a TSR of 97% for the last 3 years. That exceeds its share price return that we previously mentioned. The dividends paid by the company have thusly boosted the total shareholder return.
A Different Perspective
Although it hurts that Zhejiang Hailide New MaterialLtd returned a loss of 6.6% in the last twelve months, the broader market was actually worse, returning a loss of 10%. Of course, the long term returns are far more important and the good news is that over five years, the stock has returned 3% for each year. In the best case scenario the last year is just a temporary blip on the journey to a brighter future. It's always interesting to track share price performance over the longer term. But to understand Zhejiang Hailide New MaterialLtd better, we need to consider many other factors. Take risks, for example - Zhejiang Hailide New MaterialLtd has 3 warning signs (and 1 which is a bit concerning) we think you should know about.
If you are like me, then you will not want to miss this free list of growing companies that insiders are buying.
Please note, the market returns quoted in this article reflect the market weighted average returns of stocks that currently trade on CN exchanges.
Have feedback on this article? Concerned about the content? Get in touch with us directly. Alternatively, email editorial-team (at) simplywallst.com.
This article by Simply Wall St is general in nature. We provide commentary based on historical data and analyst forecasts only using an unbiased methodology and our articles are not intended to be financial advice. It does not constitute a recommendation to buy or sell any stock, and does not take account of your objectives, or your financial situation. We aim to bring you long-term focused analysis driven by fundamental data. Note that our analysis may not factor in the latest price-sensitive company announcements or qualitative material. Simply Wall St has no position in any stocks mentioned.